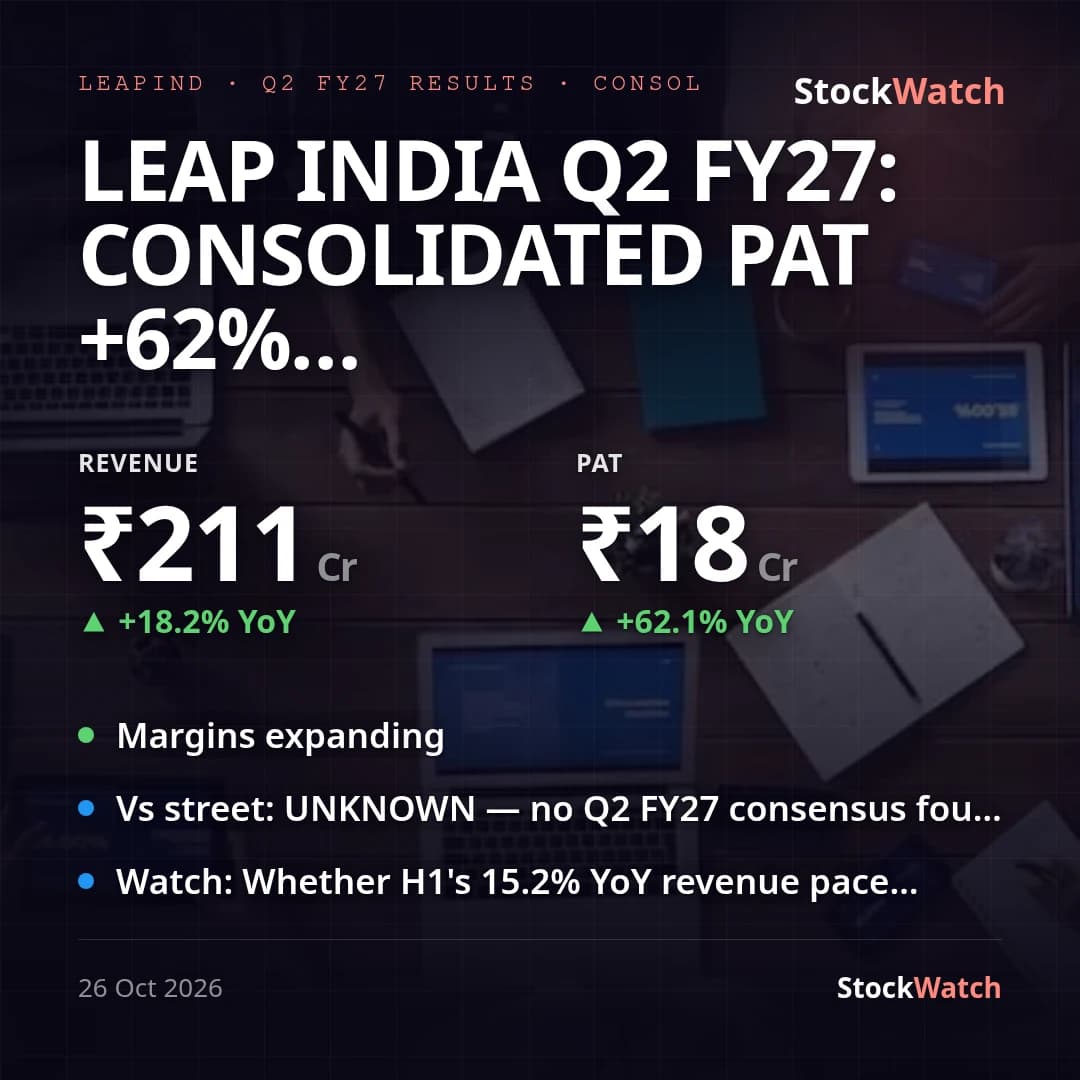
LEAP India Q2 FY27: consolidated PAT +62% YoY (~109% ex one-off charge), revenue +18%
LEAP India's consolidated Q2 FY27 (quarter ended September 30, 2026) revenue rose 18.2% YoY to ₹211.2 Cr (+3.8% QoQ), while consolidated PAT was ₹17.8 Cr, up 62.1% YoY but down 28.0% sequentially from Q1 FY27's ₹24.7 Cr. The sequential dip is not operating weakness: this quarter carries a ₹6.8 Cr one-off exceptional charge (prepayment charges on long-term borrowings/non-convertible debentures) that Q1 FY27 did not have. Adjusting for this one-off (net of an estimated ~25% effective tax shield), PAT would have been closer to ₹22.9 Cr, implying adjusted YoY growth of roughly +109% — the reported +62% materially understates the underlying trend. Standalone (India-only) tells a similar story — PAT of ₹18.1 Cr on revenue of ₹173.2 Cr, carrying the same ₹6.8 Cr charge — so standalone and consolidated are not materially divergent this quarter.
Net margin (PAT/total income) was 8.2% this quarter, down from 11.6% in Q1 FY27 but up from 6.2% a year ago; the YoY expansion is the primary read, while the QoQ compression is fully attributable to the one-off sitting below the operating line — excluding it, net margin would have been ~10.6%, still modestly below Q1. Consolidated total expenses grew 14.7% YoY versus 18.2% revenue growth, consistent with the operating leverage management has flagged on prior calls.
Against management's own FY27 guidance (from the Q1 FY27 concall) of 20%+ full-year India revenue growth and a 47–56% EBITDA margin band: H1 FY27 standalone revenue grew 15.2% YoY (₹342.1 Cr vs ₹297.1 Cr), trailing the 20% pace at the halfway mark, though management has pointed to festive/beverage-season demand lifting Q2-Q3 and Q4 as seasonally strongest (~29% of annual business), so the shortfall need not persist. We found no analyst consensus for this specific quarter — LEAP India listed only in August 2026 (IPO at ₹159/share, muted +4% debut) and brokerage coverage at listing was itself split (SBI Securities neutral, Sushil Finance cautious on FY26 revenue contraction, Anand Rathi positive long-term) — so vsStreet is unknown. No company press release accompanying this result was available in our records to cross-check management's own framing. Corporate activity this quarter included incorporating two wholly owned subsidiaries (Vimprotech Private Limited, October 1; Total Integrated Packaging Solutions Limited, October 5, both just after quarter-end) and a further ₹9.64 Cr investment in its UAE subsidiary (October 6) — continuing the international/packaging expansion behind the FY30 GCC guidance, though too early to size its P&L impact.