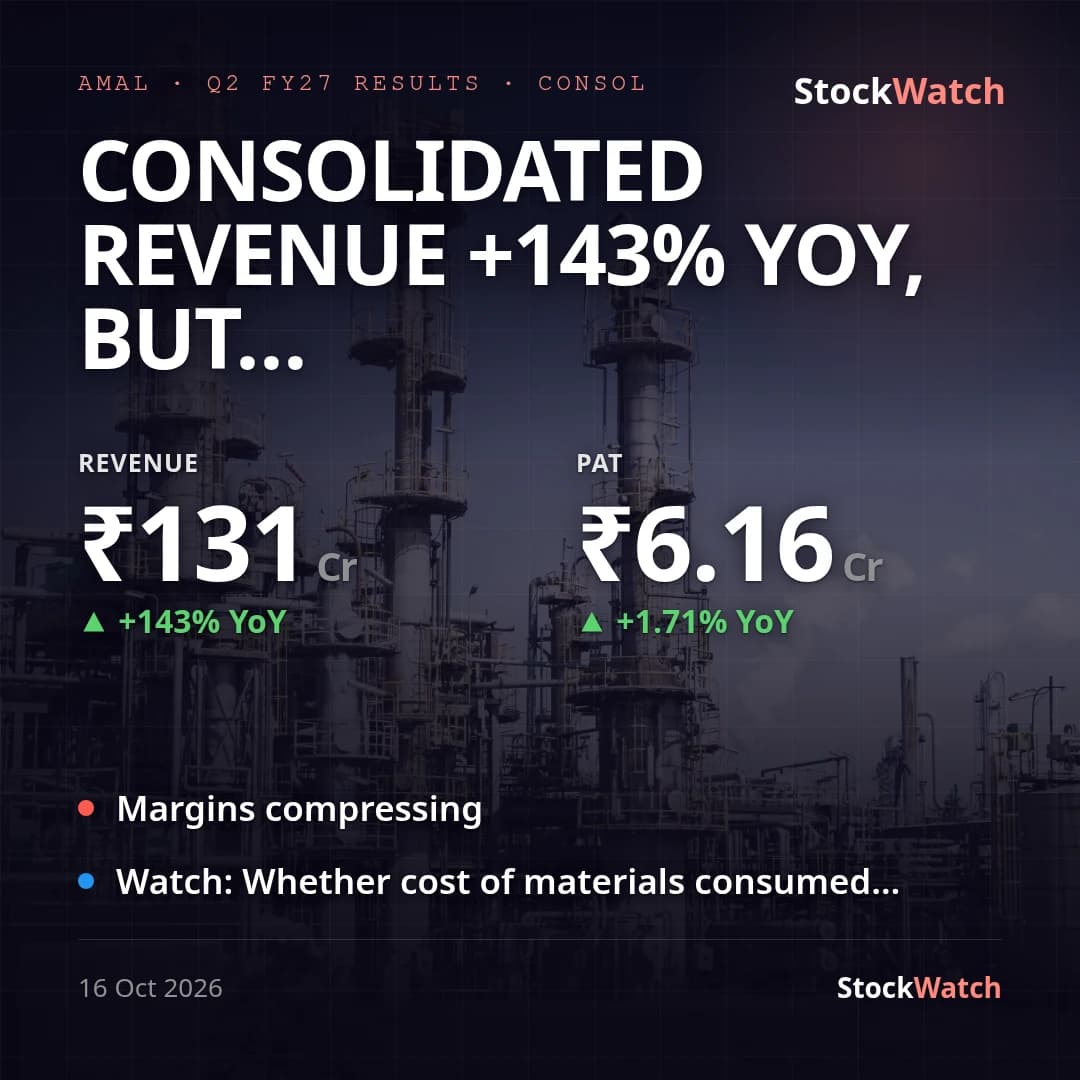
Consolidated revenue +143% YoY, but margins collapse — PAT flat, ~19% lower adjusted
Amal Ltd's consolidated (primary) revenue from operations rose 143.0% YoY to ₹131.23 Cr (₹54.00 Cr a year ago) and 35.9% QoQ (₹96.54 Cr), driven by continued ramp-up at subsidiary Amal Speciality Chemicals. Consolidated PAT, however, grew just 1.7% YoY to ₹6.16 Cr (₹6.06 Cr). Adjusting for a one-off ₹1.70 Cr Gujarat State GST incentive booked this quarter — which the company's own notes flag as making the YoY comparison invalid, since the year-ago quarter had no equivalent item — underlying PAT is actually down ~19.4% YoY. Standalone (parent-only) results tell a different story: PAT rose 267% YoY to ₹4.01 Cr on 146% revenue growth, meaning the bulk of the consolidated margin damage sits at the subsidiary level, not the parent.
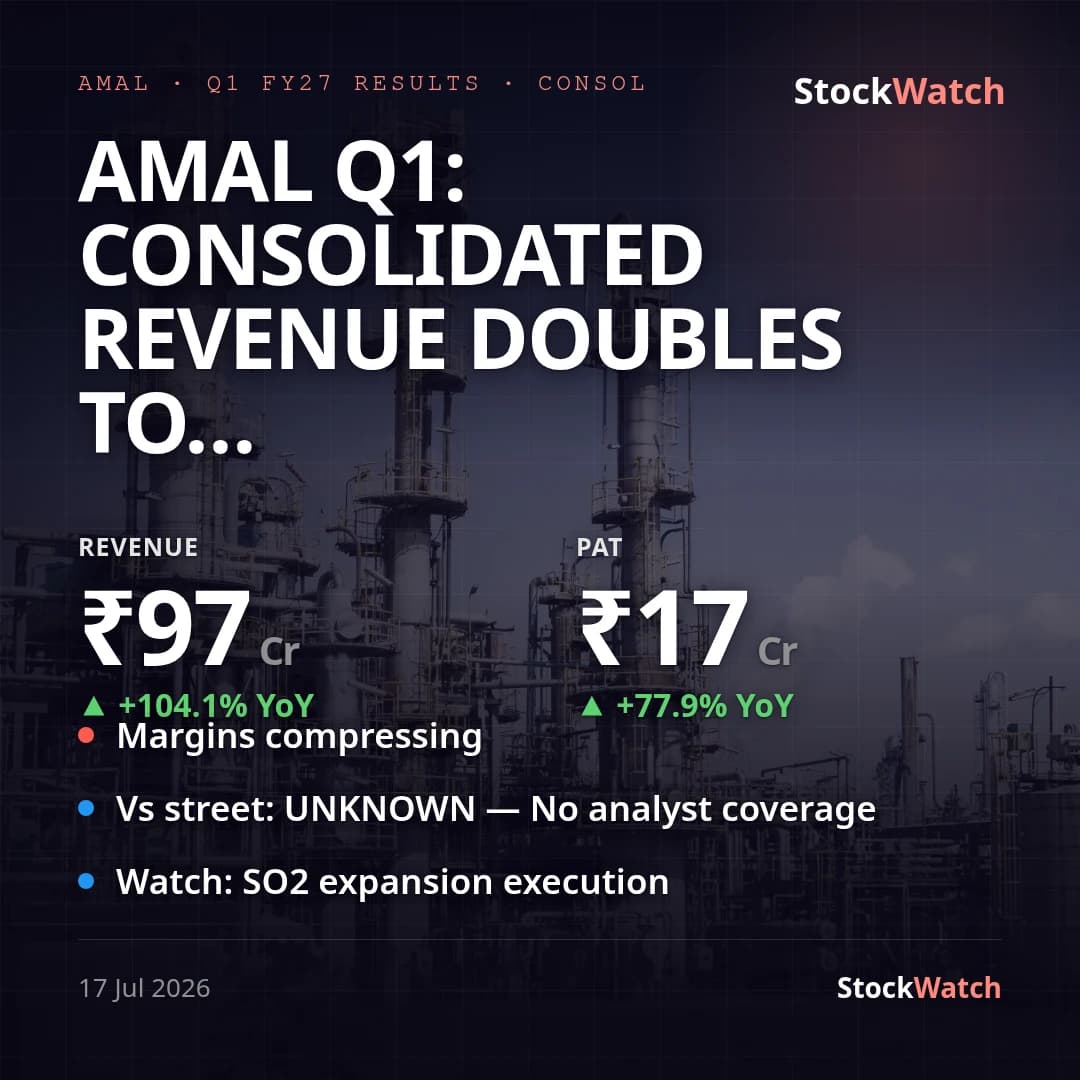
The margin bridge is on the cost line: consolidated cost of materials consumed rose to 88.2% of revenue from operations this quarter versus 71.6% a year ago, pulling consolidated OPM (EBITDA/revenue) down to 6.46% from 15.93% YoY and 17.70% QoQ, and NPM (PAT/total income) down to 4.62% from 11.12% YoY and 16.29% QoQ. QoQ comparisons are additionally distorted by Q1 FY27's planned annual maintenance shutdown, which the company explicitly flags as non-comparable — so the -63.2% QoQ PAT decline overstates the sequential deterioration.
No street consensus estimates for this quarter could be located (Amal Ltd has limited formal analyst coverage), so vsStreet is unknown; management has also issued no formal guidance or outlook in our records or in public reporting, so vsGuidance cannot be assessed beyond "no prior outlook on record." No management press release accompanied this filing to compare against. The quarter's only disclosed corporate development tied to the numbers is the GST incentive scheme recognition itself (Gujarat Industrial Policy 2015), which inflates reported other income and reported PAT growth relative to the underlying trend.
Going into Q3 FY27, the numbers set up two questions: whether the raw-material cost ratio (88.2% of revenue) eases as the subsidiary's newer capacity matures, and whether the GST incentive recurs at a similar scale each quarter, since its absence or presence materially swings the reported YoY PAT comparison.