StockWatch
·

BHARAT BIJLEE LTD.-$

BSE: 503960

P/L Snapshot

Q2 FY27 · standalone

vs Q1 FY27·vs Q2 FY26
Revenue
752.14
+34.8%+55.0%
Expenditure
691.14
+29.9%+54.4%
Net Profit
46.04
+134.5%+63.1%
OPM %
7.98%
+2.71pp+0.63pp

Shareholding

Pattern breakdown

P/L Trends

(in crores)

RevenueExpenditureNet Profit
0.00217.54435.09652.63870.17Q2 FY25Q3 FY25Q4 FY25Q1 FY26Q2 FY26Q3 FY26Q4 FY26Q1 FY27Q2 FY27
Price Chart
Reports

Bharat Bijlee Q2 FY27: PAT surges 63% YoY to ₹46 Cr as margins expand sharply

transformers · power equipment · margin expansion

ResultsQ2 FY2727 Oct 20263 minIndustrials & Infra

Nine tax notices in one evening: ₹825 crore proposed, but each company's own notice is a sliver of its own market value — 0.02% for ICICI Bank, 4.6% for Yatra

GST · show-cause notice · Section 73

ResearchDeep dive02 Oct 20267 minMetals & Mining

Bharat Bijlee Q1 FY27: PAT falls 30% YoY to ₹19.6 Cr as margins compress on rising costs

power systems · industrial systems · margin compression

ResultsQ1 FY2704 Aug 20263 minIndustrials & Infra
Latest
Quarterly Result27 Oct, 1:55 pm

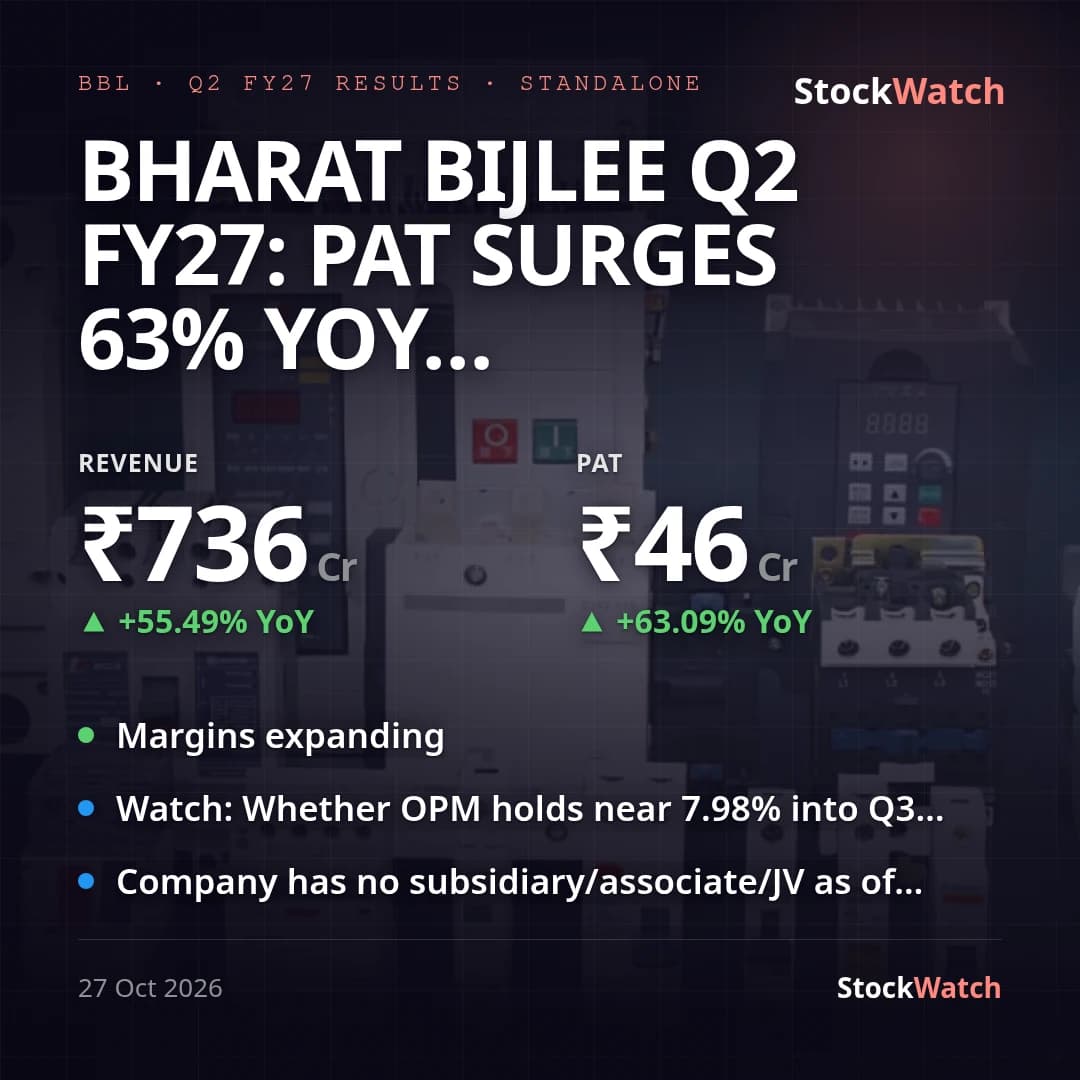
Bharat Bijlee Q2 FY27: PAT surges 63% YoY to ₹46 Cr as margins expand sharply

Bharat Bijlee's standalone revenue from operations came in at ₹736.16 Cr for Q2 FY27, up 55.5% YoY from ₹473.44 Cr and 34.5% QoQ from ₹547.17 Cr. Standalone PAT rose 63.1% YoY to ₹46.04 Cr (from ₹28.23 Cr) and 134.5% QoQ (from ₹19.63 Cr), with EPS at ₹40.73 against ₹24.98 a year ago. Profit grew faster than revenue both YoY and QoQ, so this is a margin-expansion story, not just a volume print. We found no analyst consensus or brokerage preview for this quarter (standard web search), so vs-street positioning is unknown; the company also has no formal guidance on record in our database or found via search, so a vs-guidance verdict cannot be made either way. The expansion sits on operating leverage: operating profit margin (ex-other income) rose to 7.98% from 7.35% YoY and sharply from 5.27% in the preceding Q1 FY27 quarter, while net profit margin (on total income) improved to 6.12% from 5.82% YoY and 3.52% in Q1. By segment, Power Systems (transformers, turnkey sub-station projects) drove the topline, with revenue up 69.4% YoY to ₹440.11 Cr and segment PBIT up 29.3% YoY to ₹49.18 Cr; Industrial Systems (motors, drives, magnet technology) grew revenue 38.6% YoY to ₹296.05 Cr but more than doubled segment PBIT, up 115.8% YoY to ₹30.00 Cr — the stronger margin mover of the two. Finance costs nearly doubled YoY to ₹7.55 Cr (from ₹3.86 Cr) as short-term bank borrowings rose to ₹395.04 Cr from ₹301.00 Cr at FY26-end, funding a capex ramp (capital work-in-progress up to ₹140.84 Cr from ₹82.56 Cr) and a build-up in inventories to ₹719.17 Cr from ₹474.29 Cr — consistent with Power Systems' lumpy, project-execution-driven revenue recognition rather than a one-off. This print is a sharp reversal from Q1 FY27, when standalone PAT had fallen 30% YoY to ₹19.6 Cr as margins compressed on rising costs — our records show no management commentary or concall read from that quarter to indicate whether this rebound was flagged in advance. No press release or management commentary beyond the filing's own figures and notes was available for this quarter. Two minor tax matters from our event records (a ₹58.3 Lakh income tax demand on October 1, 2026 and a ₹4.58 Lakh IT department fine on September 15, 2026) are both lakh-scale and immaterial against the crore-scale P&L, with no visible impact on this quarter's tax expense. Half-year PAT stands at ₹65.67 Cr versus ₹56.11 Cr YoY (+17.0%), still positive despite the weak Q1 FY27 starting point, underscoring that the H2-opening quarter did the heavy lifting. Going into Q3 FY27, the key question is whether the OPM recovery to ~8% holds or reverts toward Q1's ~5% given the swing already seen between consecutive quarters this year, and whether the rising short-term borrowings and finance-cost trend continues as the capex/CWIP build progresses.

27 Oct 2026, 01:55 pm

Management Change4 Aug, 2:31 pm

Bharat Bijlee Q1 FY27: PAT falls 30% YoY to ₹19.6 Cr as margins compress on rising costs

Bharat Bijlee's standalone revenue rose 17.7% YoY to ₹547.17 Cr in Q1 FY27, but PAT fell 29.6% YoY to ₹19.63 Cr (EPS ₹17.37 vs ₹24.66) as costs outran the topline. Net profit margin compressed to 3.52% of total income from 5.87% a year ago, and operating margin (EBITDA less other income, over revenue) fell to 5.27% from 7.24% YoY — both metrics also down from Q4 FY26's 5.06%/7.20%. Sequentially, revenue and PAT dropped 28.7% and 50.1% respectively, but that is largely seasonal: Q4 (Jan-Mar) is the company's strongest quarter on year-end project execution, so the YoY read is the meaningful one here, and on that basis profit growth trailed revenue growth by a wide margin. The squeeze shows up on three lines. Materials and inventory-linked costs (cost of materials consumed + stock-in-trade purchases + inventory change) rose ~20.3% YoY to ₹414.98 Cr against 17.7% revenue growth; other expenses jumped 27.6% YoY to ₹42.38 Cr; and finance costs nearly quadrupled YoY to ₹7.80 Cr from ₹2.03 Cr, consistent with Power Systems segment liabilities rising to ₹524.65 Cr from ₹342.21 Cr a year earlier. At the segment level the two businesses diverged sharply: Power Systems revenue grew a modest 3.0% YoY but its segment PBT collapsed 52.6% to ₹16.86 Cr, while Industrial Systems revenue grew 37.4% YoY and its segment PBT nearly doubled to ₹29.34 Cr — Industrial Systems carried the topline and most of what profitability there was. There is no prior management guidance or concall commentary on record to benchmark this print against, and the filing itself gives no forward guidance. No street/consensus estimates for this stock turned up in available previews, so the beat/miss call versus expectations is unknown. The result is standalone-only since the company has no subsidiary, associate or joint venture as of the quarter-end. Going into Q2, the two swing factors are whether Power Systems' segment profitability recovers from this quarter's sharp drop despite flat-ish revenue, and whether the elevated finance-cost run rate (₹7.80 Cr) persists as segment liabilities stay elevated.

4 Aug 2026, 02:31 pm

Corporate Events

Board MeetingBBL
2026
27Oct

Board Meeting

The meeting of the Board of Directors of the Company is sche…

BSE Filing ↗
Board MeetingBBL
2026
4Aug

Board Meeting

A Meeting of the Board of Directors of the Company is schedu…

BSE Filing ↗
Board MeetingBBL
2026
23Jul

Board Meeting

To receive, consider and adopt the Financial Statements. To…

BSE Filing ↗
DividendBBL
2026
15Jul

₹35 / share

BSE Filing ↗
Board MeetingBBL
2026
12May

Board Meeting

To consider and approve audited annual accounts, financial r…

BSE Filing ↗
Board MeetingBBL
2026
9Feb

Board Meeting

Consider and approve the Unaudited Financial Results of the …

BSE Filing ↗
Board MeetingBBL
2025
16Oct

Board Meeting

Consider and approve the Unaudited Financial Results

BSE Filing ↗
DividendBBL
2025
4Sep

₹5 / share

BSE Filing ↗
Board MeetingBBL
2025
23Jul

Board Meeting

Intimation of Board Meeting and closure of Trading Window, C…

BSE Filing ↗
Board MeetingBBL
2025
16May

Board Meeting

Audited Annual Accounts, Audit Report, Audited Financial Res…

BSE Filing ↗
Board MeetingBBL
2025
4Feb

Board Meeting

Consideration and approval of the Unaudited Financial Result…

BSE Filing ↗
Board MeetingBBL
2024
8Nov

Board Meeting

Consider and approve the Unaudited Financial Results

BSE Filing ↗
Board MeetingBBL
2024
18Jul

Board Meeting

Unaudited Financial Results for the quarter ended June 30, 2…

BSE Filing ↗
Board MeetingBBL
2024
17May

Board Meeting

Consideration and Approval of Audited Financial Results for …

BSE Filing ↗
Stock SplitBBL
2024
24Apr

1:2

BSE Filing ↗
Board MeetingBBL
2024
14Feb

Board Meeting

Consider and approve the proposal for sub-division / split o…

BSE Filing ↗
Board MeetingBBL
2024
12Jan

Board Meeting

consider and approve the Unaudited Financial Results for the…

BSE Filing ↗
Board MeetingBBL
2023
30Oct

Board Meeting

Consider and approve the Unaudited Financial Results of the …

BSE Filing ↗