

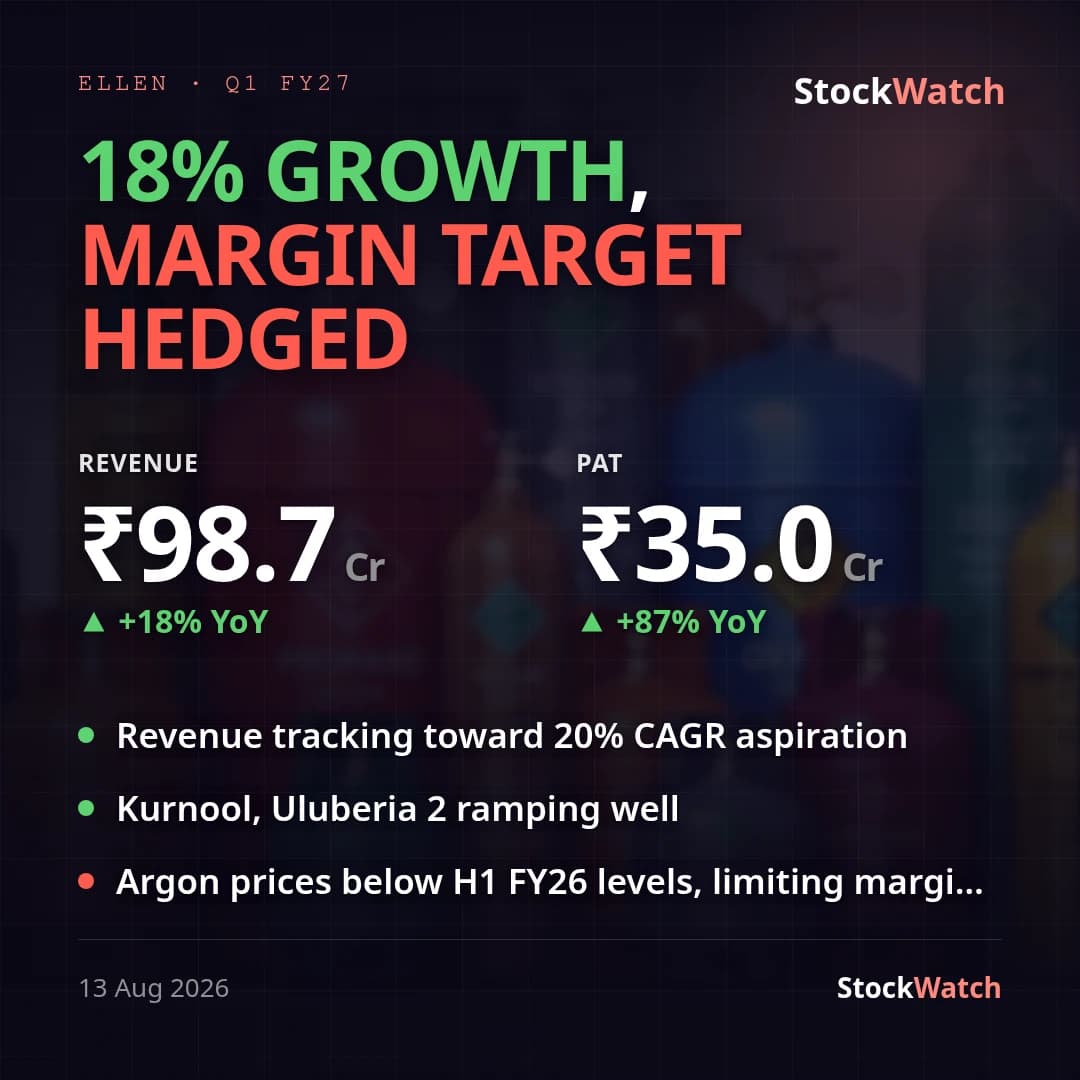
18% Growth Delivered, but 40% Margin Target Moves to 'Longer-Term'
capacity ramp-up · margin aspiration · argon pricing
BSE: 544421
P/L Snapshot
Q1 FY27 · standalone
Shareholding
Pattern breakdown
P/L Trends
(in crores)
capacity ramp-up · margin aspiration · argon pricing

capacity ramp-up · argon pricing volatility · merchant expansion
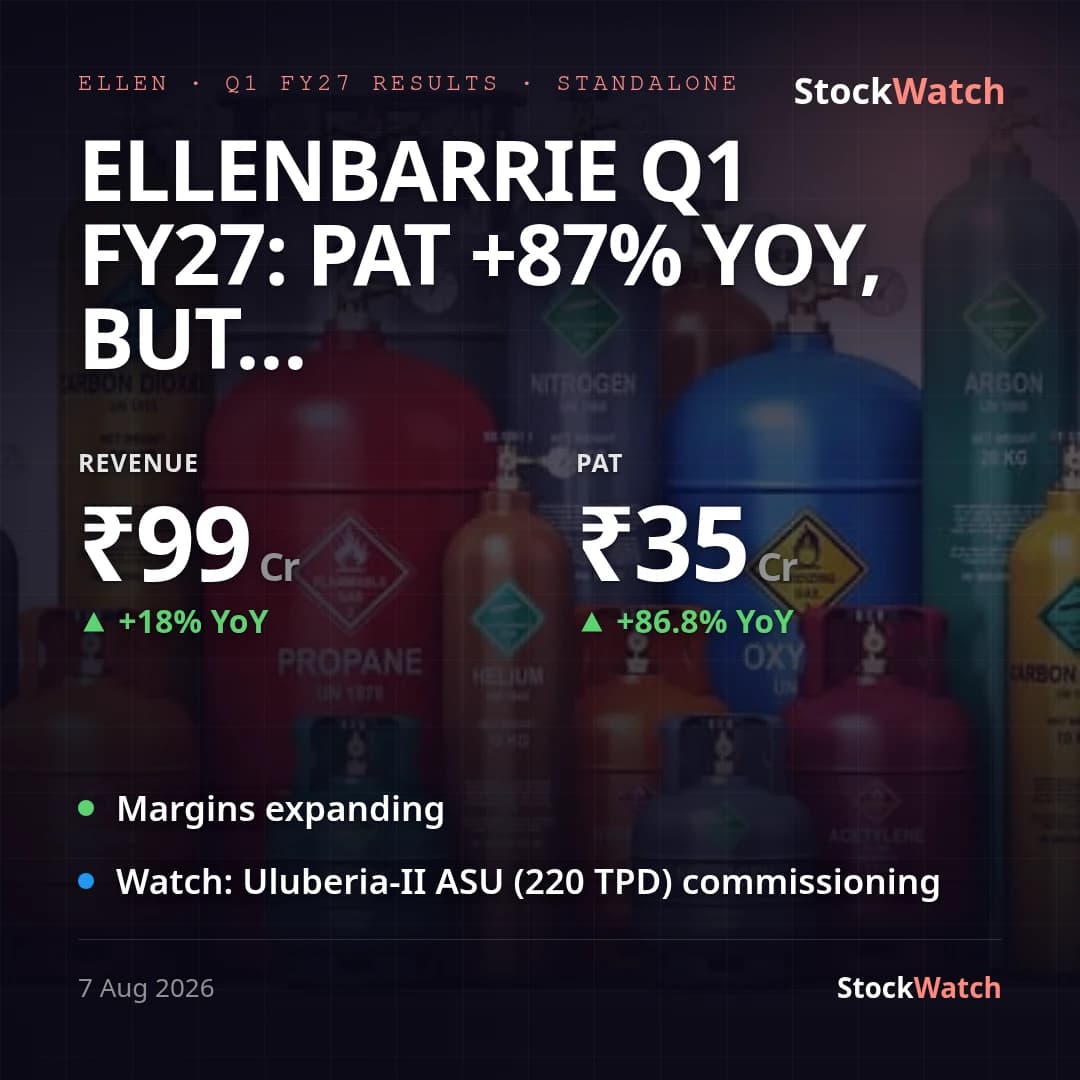
industrial gases · margin expansion · debt prepayment
Corporate Events
Board Meeting
The meeting of the Board of Directors is scheduled to consid…
BSE Filing ↗Board Meeting
The 52nd Annual General Meeting (AGM) will be held to consid…
BSE Filing ↗Board Meeting
The meeting of the Board of Directors is scheduled to consid…
BSE Filing ↗Board Meeting
Un-audited Financial Results of the Company for the quarter …
BSE Filing ↗