StockWatch
·

GODREJ INDUSTRIES LTD.

BSE: 500164

P/L Snapshot

Q1 FY27 · standalone

vs Q4 FY26·vs Q1 FY26
Revenue
1.3K
-2.9%+25.1%
Expenditure
1.3K
-1.5%+22.1%
Net Profit
-5.41
-141.5%+82.0%
OPM %
15.20%
+6.10pp-0.53pp

Shareholding

Pattern breakdown

P/L Trends

(in crores)

RevenueExpenditureNet Profit
-240.43204.18648.791.1K1.5KQ2 FY25Q3 FY25Q4 FY25Q1 FY26Q2 FY26Q3 FY26Q4 FY26Q1 FY27
Price Chart
Reports

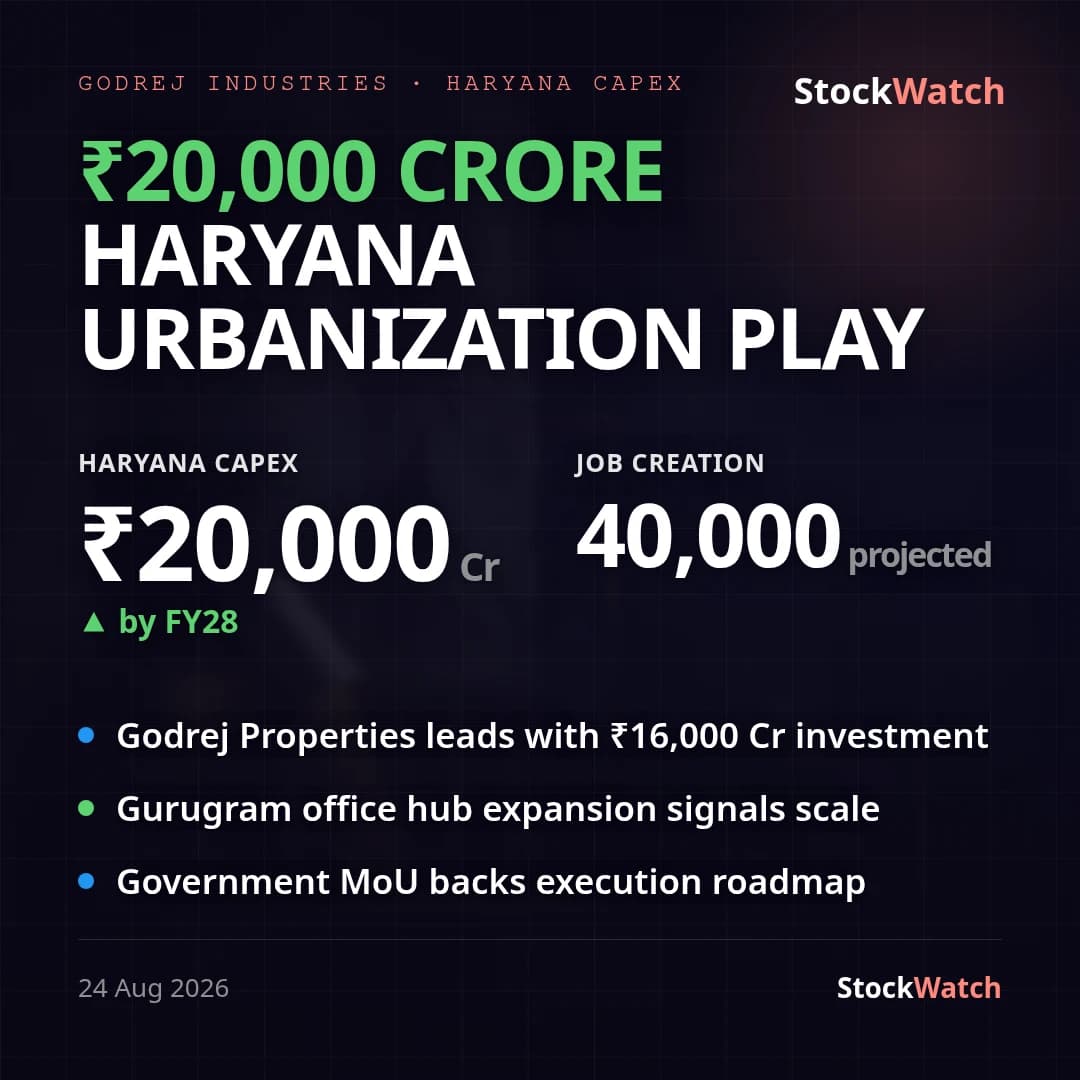
Godrej's ₹20,000 Crore Haryana Bet: When Infrastructure Ambition Meets Execution

Haryana investment · Godrej Properties · capex
ResearchDeep dive24 Aug 20266 min

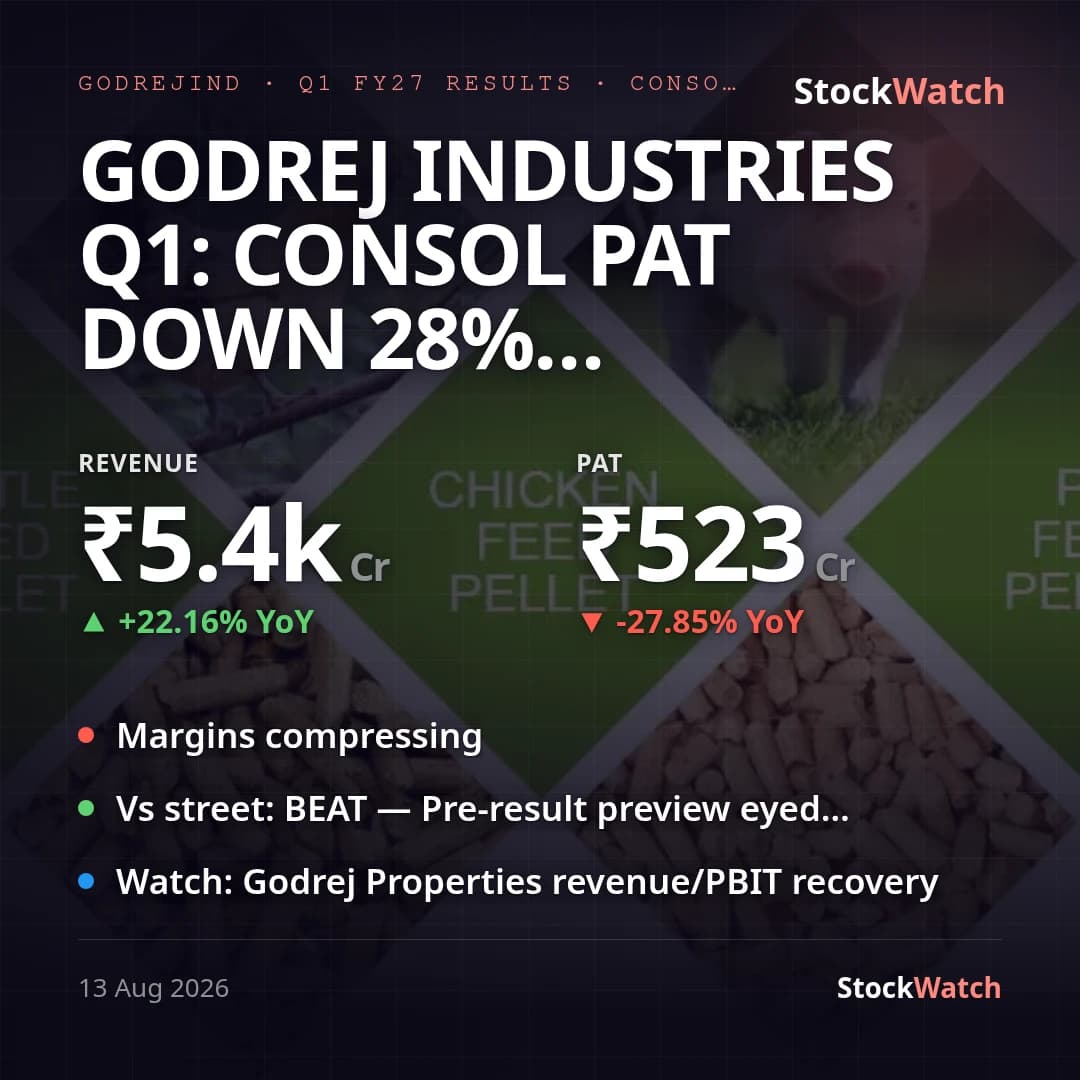
Godrej Industries Q1: consol PAT down 28% YoY to ₹523 Cr despite 22% revenue growth

chemicals margin · real estate slowdown · margin compression
ResultsQ1 FY2713 Aug 20263 minFMCG

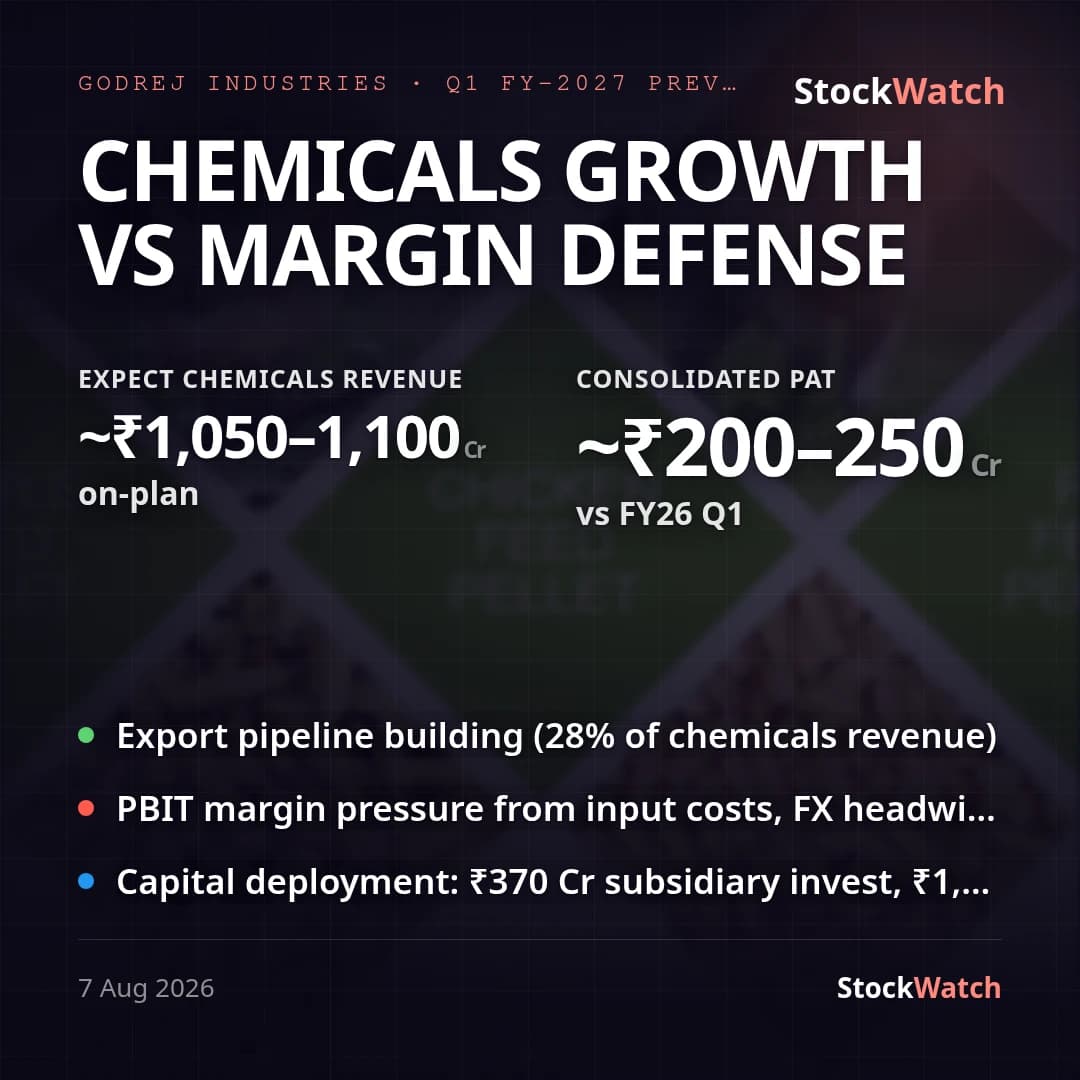
Godrej Industries Q1: Sustaining Momentum in Chemicals Amid Margin Headwinds

chemicals · export growth · margin compression

Result previewQ1 FY2708 Aug 20263 minFMCG
Latest
Board Meeting13 Aug, 1:25 pm

Godrej Industries Q1: consol PAT down 28% YoY to ₹523 Cr despite 22% revenue growth

Godrej Industries' consolidated Q1 FY27 (quarter ended June 30, 2026) revenue rose 22.2% YoY to ₹5,448.09 Cr from ₹4,459.80 Cr, but consolidated PAT (before minority split) fell 27.9% YoY to ₹523.36 Cr from ₹725.35 Cr — profit attributable to owners was ₹284.36 Cr. Sequentially both lines fell (revenue -29.2%, PAT -37.8%) against an unusually large Q4 FY26 base skewed by real-estate project completions. This is a soft bottom-line quarter against strong topline growth, and it still lands ahead of our pre-result preview, which had flagged consolidated PAT in the ₹200-250 Cr range going in — the ₹284 Cr owners' PAT (₹523 Cr on a total basis) is a beat on that marker even as the YoY trend is a decline. The YoY profit decline sits below the operating line, not within it. Operating margin actually expanded to 10.55% from 8.90% a year ago, but net profit margin compressed to 9.61% from 16.26% as Other Income fell 27.5% YoY to ₹912.21 Cr (off an elevated ₹1,259.17 Cr base) and Finance Costs rose 29.3% YoY to ₹745.14 Cr, tracking a rise in the gross debt-equity ratio to 2.38x from 1.90x. The bigger structural driver is segment mix: Estate and Property Development (Godrej Properties) — the group's largest profit pool — saw segment revenue fall 17.6% YoY to ₹1,334.86 Cr and PBIT nearly halve to ₹501.82 Cr from ₹920.57 Cr, consistent with the lumpy, completion-linked nature of real-estate revenue recognition. Neither the current nor year-ago quarter carried exceptional items, so the swing is operational/base-effect driven, not one-off.

13 Aug 2026, 01:25 pm

Corporate Events

Board MeetingGODREJIND
2026
13Aug

Board Meeting

The 38th Annual General Meeting ("AGM") of Godrej Industries…

BSE Filing
Board MeetingGODREJIND
2024
13Nov

Board Meeting

Consider and approve Unaudited Financial Results

BSE Filing
Board MeetingGODREJIND
2024
17May

Board Meeting

Consider and approve the Audited Financial Results (Standalo…

BSE Filing
Board MeetingGODREJIND
2024
9Feb

Board Meeting

Consider and approve Unaudited Financial Results (Standalone…

BSE Filing
Board MeetingGODREJIND
2023
8Nov

Board Meeting

consider and approve Unaudited Financial Results (Standalone…

BSE Filing
Board MeetingGODREJIND
2023
25Oct

Board Meeting

Consider and approve amendments to terms / conditions of Uns…

BSE Filing
Board MeetingGODREJIND
2023
11Aug

Board Meeting

Consider and approve the Unaudited Financial Results (Standa…

BSE Filing