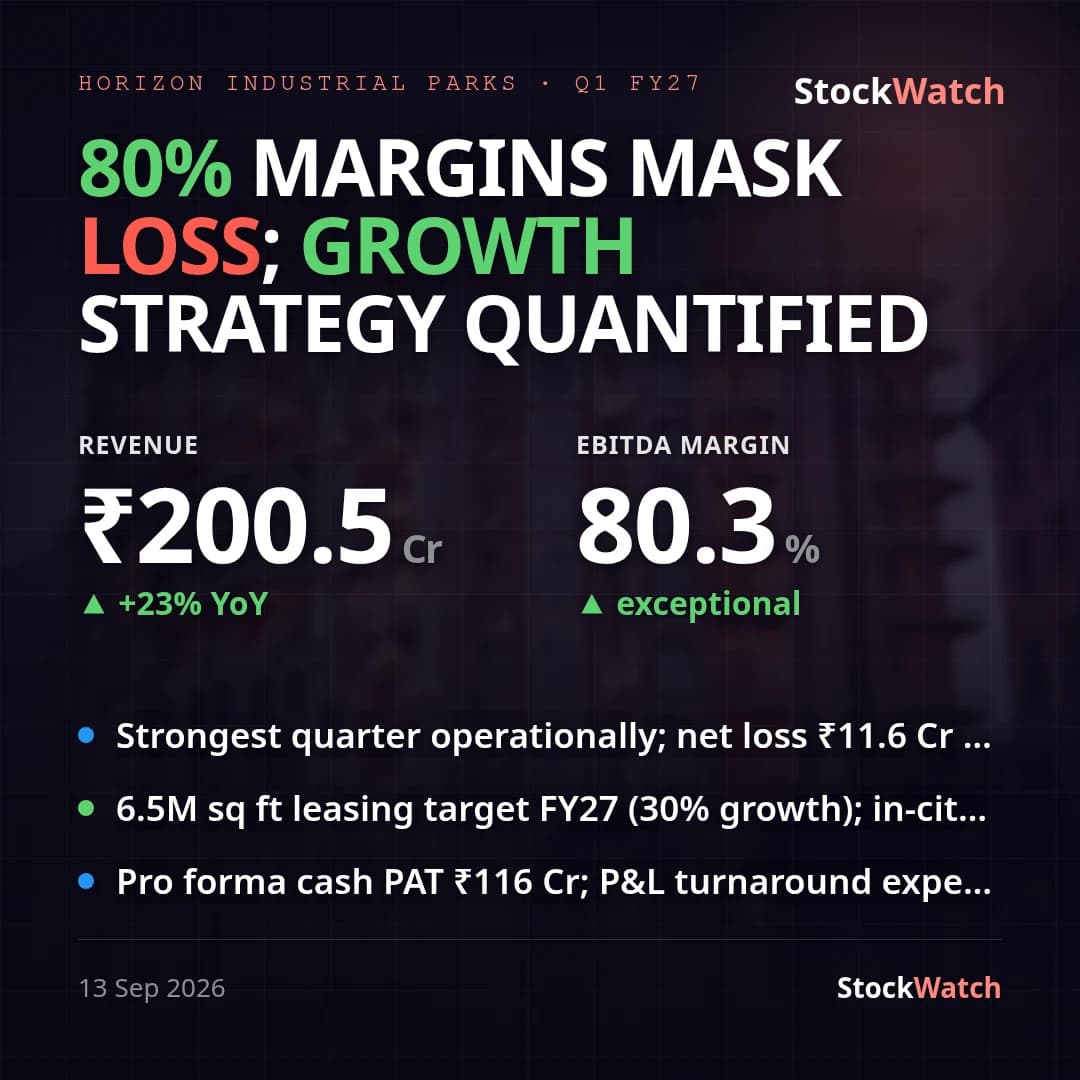
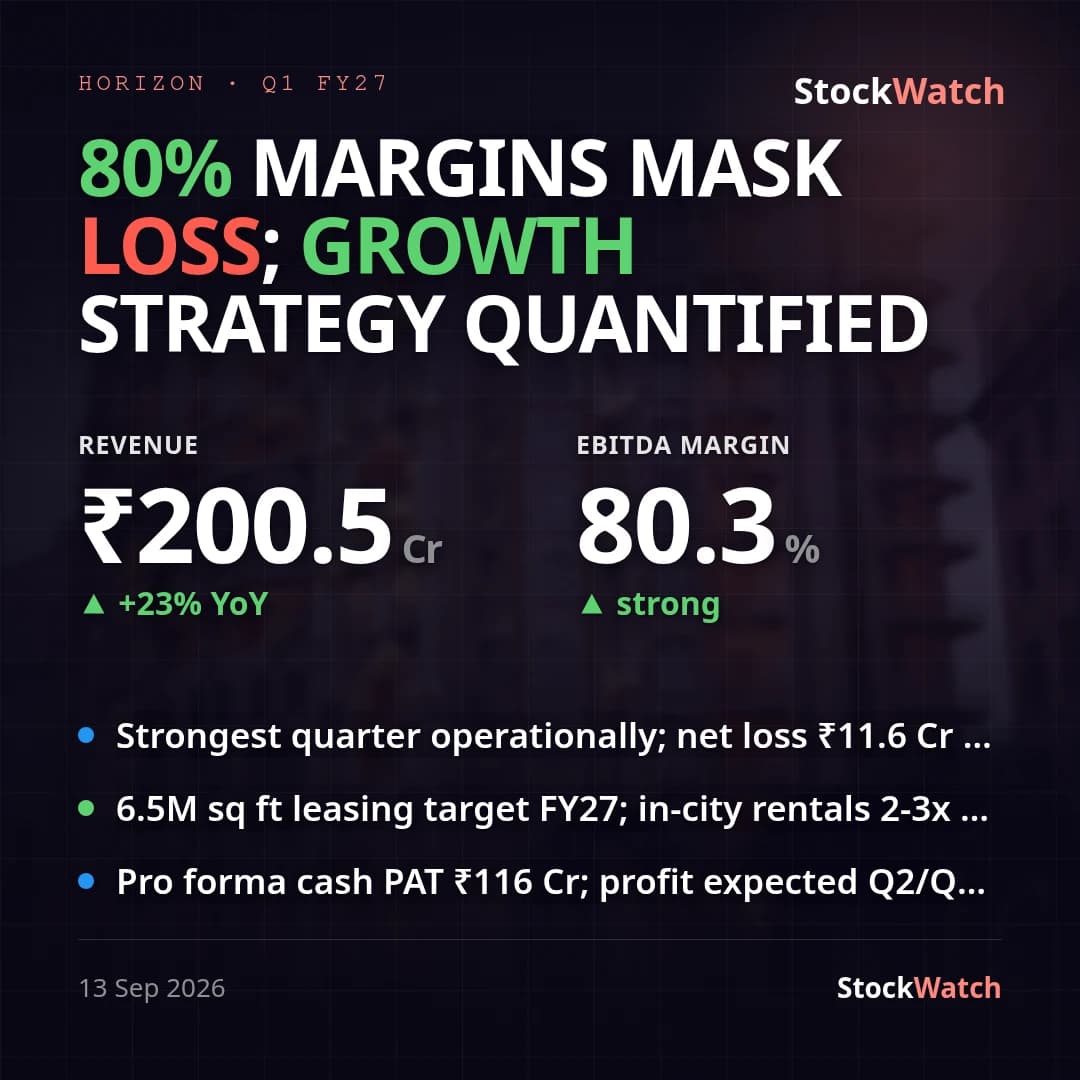
Horizon Industrial Parks: consol loss narrows 82% YoY to ₹11.6 Cr, but reverses Q4 profit
Horizon Industrial Parks' first quarterly print as a listed company shows a consolidated (primary basis) net loss of ₹11.6 Cr for Q1 FY27, against a ₹65.5 Cr loss a year ago — an 82% YoY narrowing — but a reversal from Q4 FY26's slim ₹0.6 Cr profit. Revenue from operations grew 23.1% YoY and 6.6% QoQ to ₹200.5 Cr, landing at the top of the ₹180–200 Cr range we flagged pre-result, so the growth story the FY26 numbers (77% revenue growth) implied held up in Q1.
The swing back to loss versus Q4 traces to costs below the revenue line, not a topline miss: finance costs rose 11% QoQ to ₹131.3 Cr (still down 2.9% YoY) even before the post-quarter IPO deleveraging, and depreciation rose 6.7% QoQ / 33.9% YoY to ₹76.5 Cr as more assets came online. Computed EBITDA margin works out to roughly 80% this quarter — essentially flat with FY26's full-year 79.2% margin, but short of the 85–88% range we'd expected pre-result, so margin expansion is not yet showing up even as revenue scales. Standalone PAT of ₹63.5 Cr is a holding-company artefact (₹77.1 Cr of other income, chiefly upstream dividends/interest from subsidiaries) and should not be read against the consolidated loss as a contradiction.
Coverage of this stock remains thin six weeks post-listing, so there is no formal street consensus to benchmark against; against our own pre-result expectations, revenue and finance costs landed in range while EBITDA margin came in below the guided band. Screener data corroborates the ~79% FY26 EBITDA margin and notes analysts had flagged a lower interest burden as the path to PAT breakeven in FY27 — a thesis Q1's YoY loss-narrowing is broadly consistent with, though the QoQ reversal shows that path isn't linear. Management has not issued formal guidance on record, and no press release commentary was available to check against the numbers. Post-quarter, the company completed its ₹2,600 Cr IPO (listed August 24, 2026) and subsidiary Vidarbha Cargo received a ₹40 Cr Maharashtra government capital subsidy for its Ultra Mega Logistics Park (capitalized against asset cost, no P&L impact this quarter) — neither shows up in these Q1 numbers but both bear on the deleveraging question the pre-result preview raised.
Going into Q2, the read-through is whether IPO proceeds now deployed against debt bring finance costs down from ₹131.3 Cr, and whether EBITDA margin recovers toward the 85–88% band as the newer assets (driving the D&A jump) start contributing revenue rather than just cost.