Jinkushal Q1 FY27: consolidated PAT falls 66% YoY to ₹2.2 Cr despite 16% revenue growth
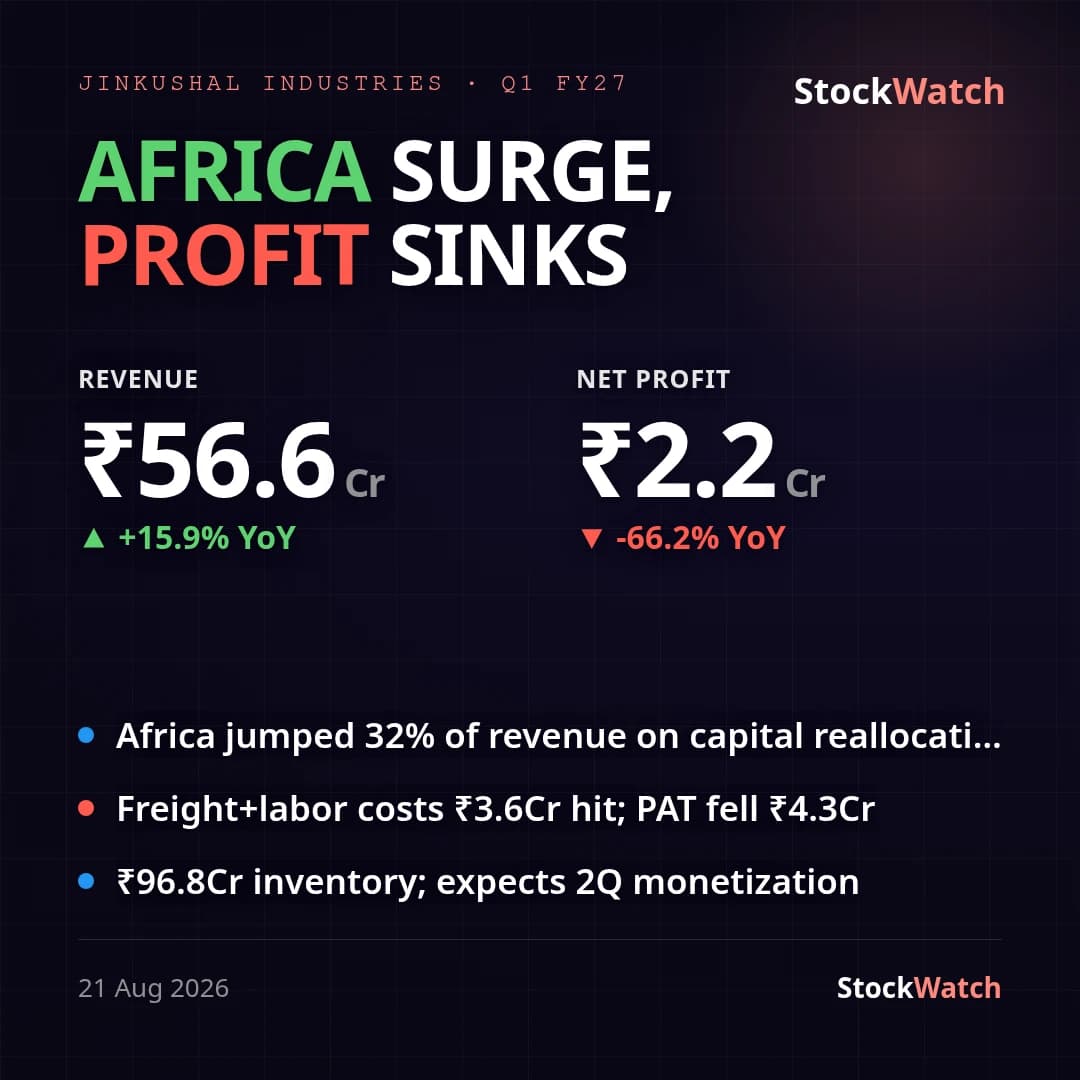
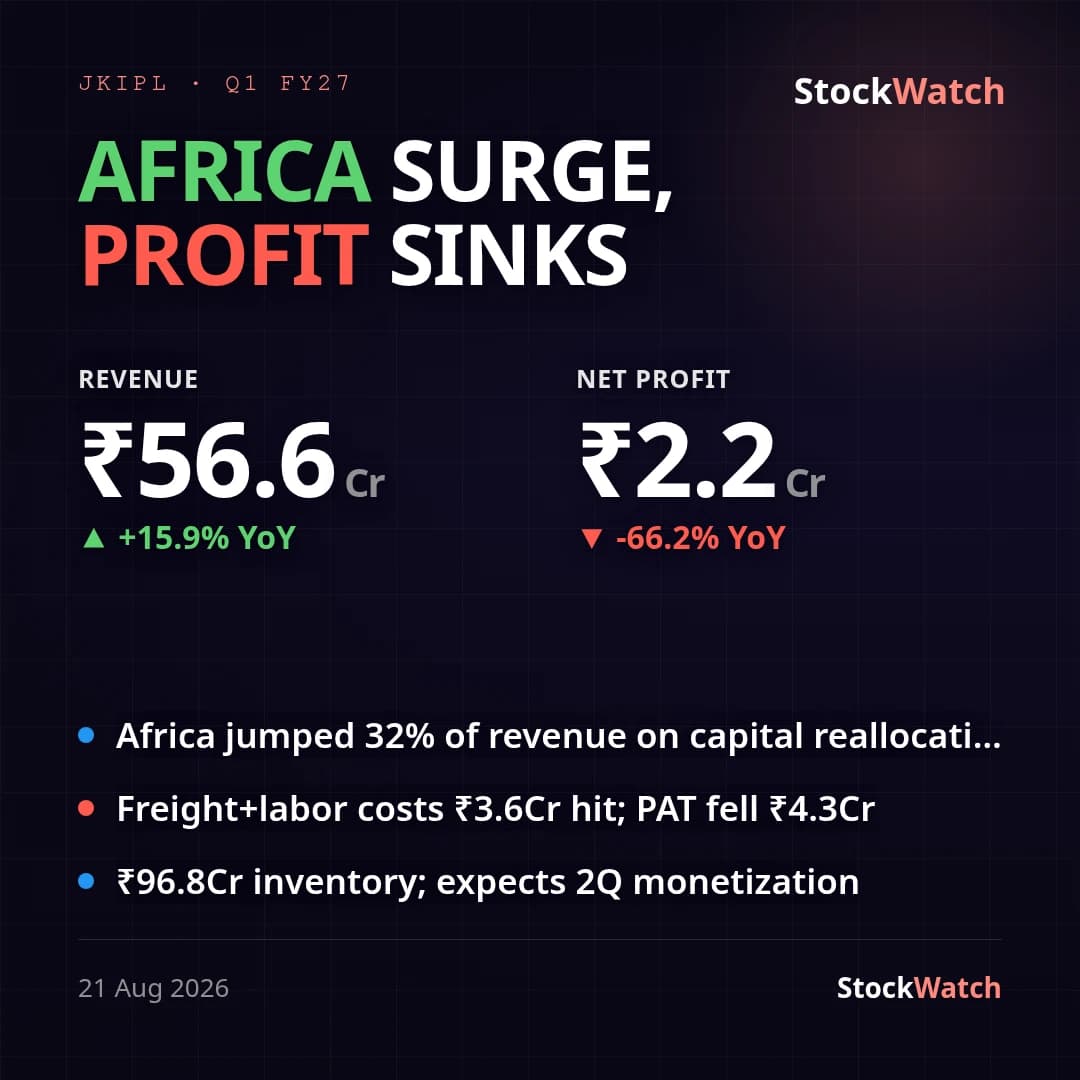
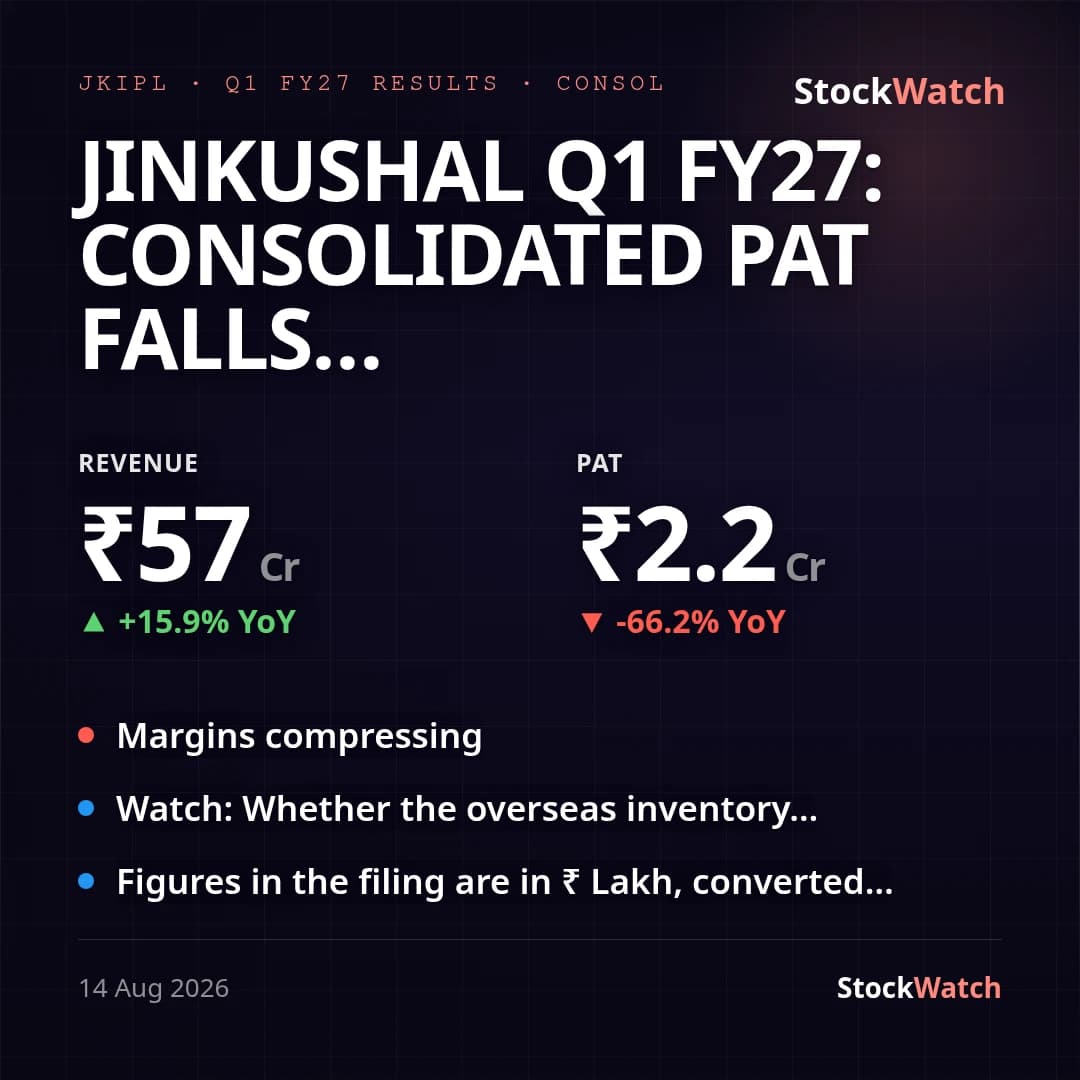
Jinkushal Industries' consolidated Q1 FY27 (quarter ended 30 June 2026) revenue from operations rose 15.9% YoY to ₹56.57 Cr (₹48.82 Cr in Q1 FY26), but consolidated PAT fell 66.2% YoY to ₹2.20 Cr (₹6.51 Cr a year ago) as net profit margin compressed to 3.89% from 13.32% and operating margin to 14.12% from 17.92%. Basic EPS was ₹0.63 versus ₹2.01 a year ago (not annualised). Sequentially, revenue and PAT fell 70.5% and 81.2% respectively from the March-26 quarter's ₹192.00 Cr/₹11.67 Cr — but that comparison is a poor read given the company's lumpy, deal-based machinery-trading revenue recognition (large deliveries typically close in Q4), not a genuine sequential slowdown. Standalone PAT, by contrast, fell a much milder 12.1% YoY to ₹3.31 Cr on 37.4% YoY revenue growth to ₹51.29 Cr — the wide gap between standalone and consolidated PAT trajectories reflects a drag from the overseas subsidiaries, and readers comparing the two bases should note this >50-point divergence in growth.
The margin compression sits on the expense side rather than pricing: consolidated employee benefit expense rose 73.5% YoY to ₹3.83 Cr and direct expenses rose 79.3% YoY to ₹3.79 Cr, consistent with management's stated post-IPO strategy of investing heavily in marketing, senior talent and the HexL brand. Finance costs also rose to ₹1.46 Cr from ₹1.28 Cr on a larger working-capital base. There were no exceptional items in either period, so the YoY profit decline is entirely operating in nature.
Management's February 2026 concall guidance flagged both this margin-investment phase and a plan to monetise a then-"record ₹70 Cr" of overseas inventory into revenue "in the coming quarters" — the investment phase is visible in this print, but the inventory monetisation is not: change in inventories was a negative ₹43.68 Cr this quarter (versus -₹1.05 Cr YoY), meaning stock-in-trade built up further rather than converting to sales, and the auditor's review note shows the two overseas subsidiaries (Hexco Global FZCO, Dubai and Hexco Global USA LLC) now carry total assets of ₹281.89 Cr against just ₹0.64 Cr of comprehensive income for the quarter. No formal analyst/street estimates specific to this quarter were found — the company is a recently listed, thinly covered small-cap — so vs-street is unknown. The quarter's other corporate action, incorporation of a new Abu Dhabi step-down subsidiary (Hexco Global Machines LLC-SPC) on 3 August 2026, is a non-adjusting event with no impact on these financials and has yet to commence commercial operations.