Leela Q1 consol PAT 5.6x YoY to ₹49 Cr on deleveraging; revenue +28%, EBITDA +19%
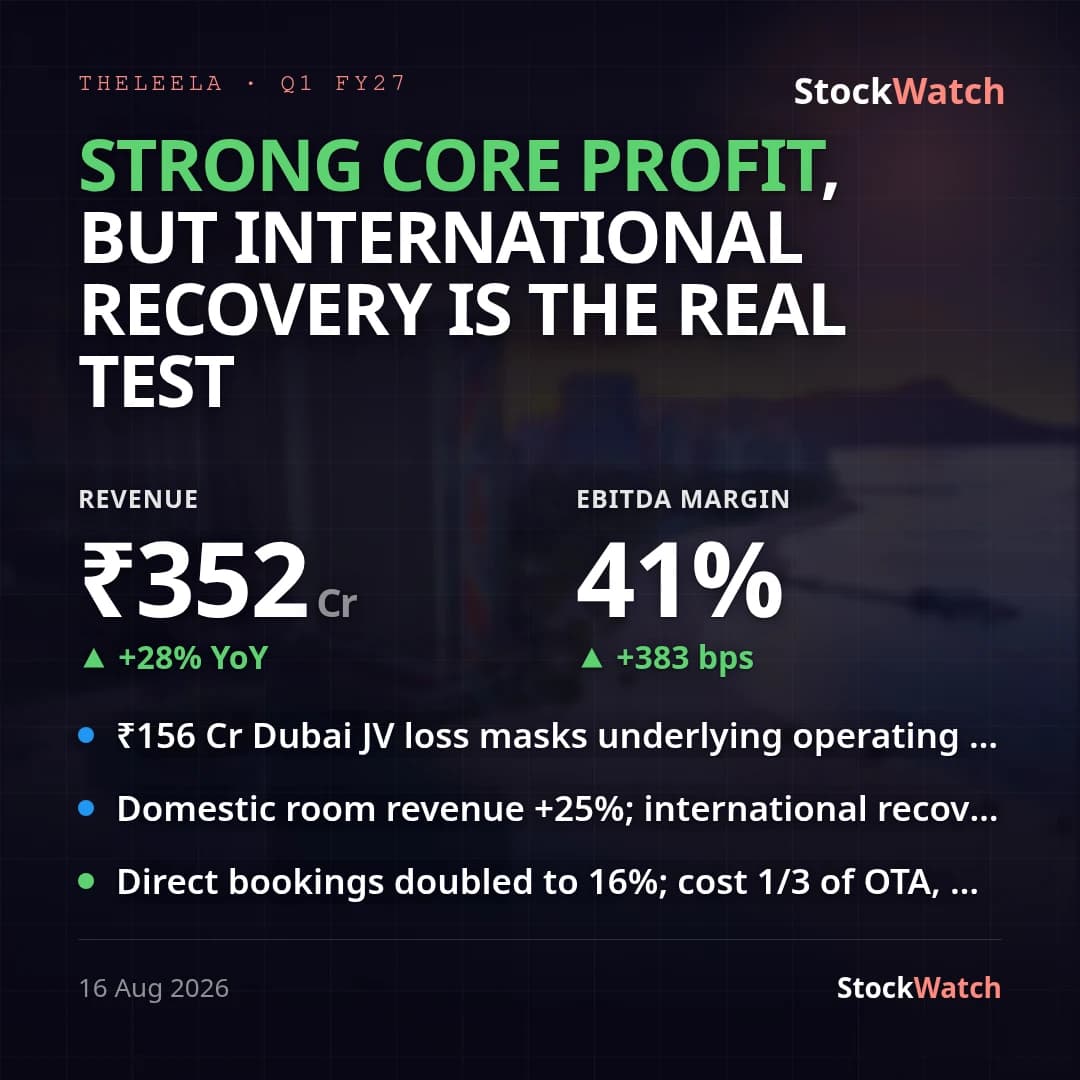
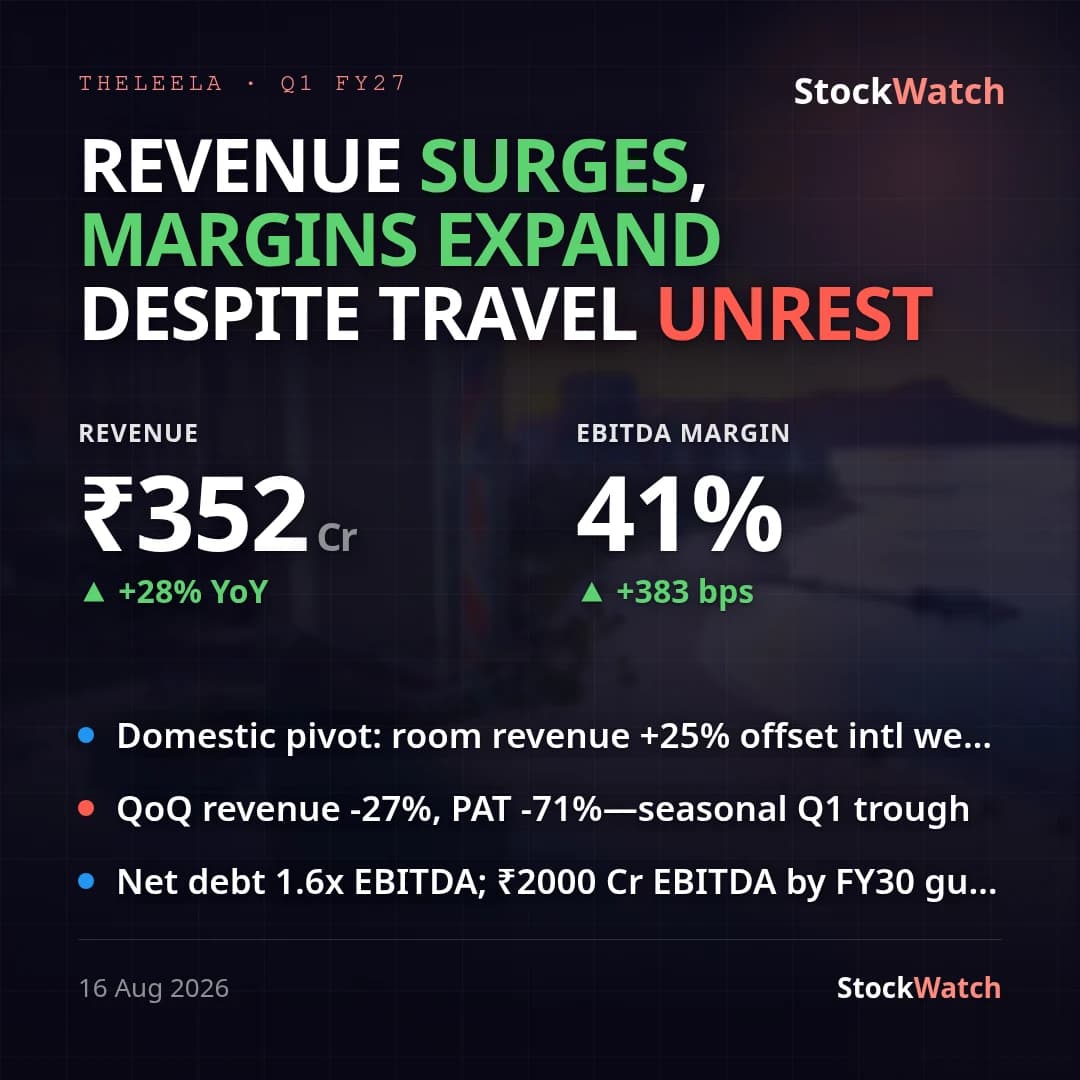
Leela Palaces reported a strong year-on-year Q1 FY27 (quarter ended June 30, 2026): consolidated revenue from operations rose ~28% to ₹351.96 Cr (₹274.79 Cr a year ago) and consolidated PAT jumped to ₹48.76 Cr from just ₹8.70 Cr — a 5.6x increase. The optical scale of that profit jump is flattered by a very low year-ago base: Q1 FY26 was the IPO-listing quarter (listed June 2, 2025) still carrying pre-IPO leverage. The real engine is deleveraging — finance costs fell to ₹39.3 Cr from ₹86.0 Cr a year ago after ₹2,300 Cr of IPO proceeds were used to repay borrowings — which, combined with operating leverage, lifted net margin to 13.5% from 2.9%. Operationally the quarter was solid on its own terms: EBITDA grew ~19% YoY to ₹151.9 Cr and operating margin expanded ~380 bps to 40.7% (from 36.9%).
The sequential picture looks weak — revenue down 27% and PAT down 72% versus Q4 FY26 (₹484.42 Cr / ₹171.72 Cr) — but this is pure seasonality, which management flags in the notes: Q1 (Apr–Jun monsoon) is the luxury-hotel off-season versus the Jan–Mar peak, so the QoQ drop is not a deterioration. Year-on-year is the fair read, and on that basis the print delivers on management's Q4-concall guidance of double-digit revenue AND EBITDA growth for Q1 driven by a robust domestic market — revenue (~28%) comfortably cleared the bar and EBITDA (~19%) met it. There is no formal Street consensus for this newly-listed name; the quantified pre-result view was management's own double-digit guidance plus Nomura's Buy (TP ₹510) on ultra-luxury demand — both effectively confirmed.
Two items temper the group read. Consolidated PBT absorbed a ₹15.6 Cr share of net LOSS from joint ventures/associates (versus roughly nil a year ago), the drag largely from the overseas Sofitel/BKC JV structure, and one subsidiary posted a ₹17.7 Cr net loss. That is why standalone PAT (₹60.86 Cr, aided by ₹40.65 Cr of parent-level other income) sits above consolidated PAT (₹48.76 Cr) — readers comparing the two figures should note the standalone number overstates group profitability. Alongside the results the board approved investing up to ₹120 Cr into wholly-owned subsidiary Schloss Tadoba to fund hotel projects and capex, consistent with the stated FY27 expansion push while management targets occupancy in the low-70s and a stable ~1.6x Net Debt/EBITDA. Concurrent disclosures — revised promoter encumbrance and a 55.91% promoter pledge — are corporate-action noise unrelated to the operating print.