StockWatch
·

M & B Engineering Ltd

BSE: 544470

P/L Snapshot

Q1 FY27 · standalone

vs Q4 FY26·vs Q1 FY26
Revenue
270.05
-15.6%+16.1%
Expenditure
250.58
-14.7%+18.0%
Net Profit
14.64
-24.1%-4.0%
OPM %
7.77%
-1.12pp-3.26pp

Shareholding

Pattern breakdown

P/L Trends

(in crores)

RevenueExpenditureNet Profit
0.0089.55179.10268.65358.20Q1 FY26Q2 FY26Q3 FY26Q4 FY26Q1 FY27
Price Chart
Reports

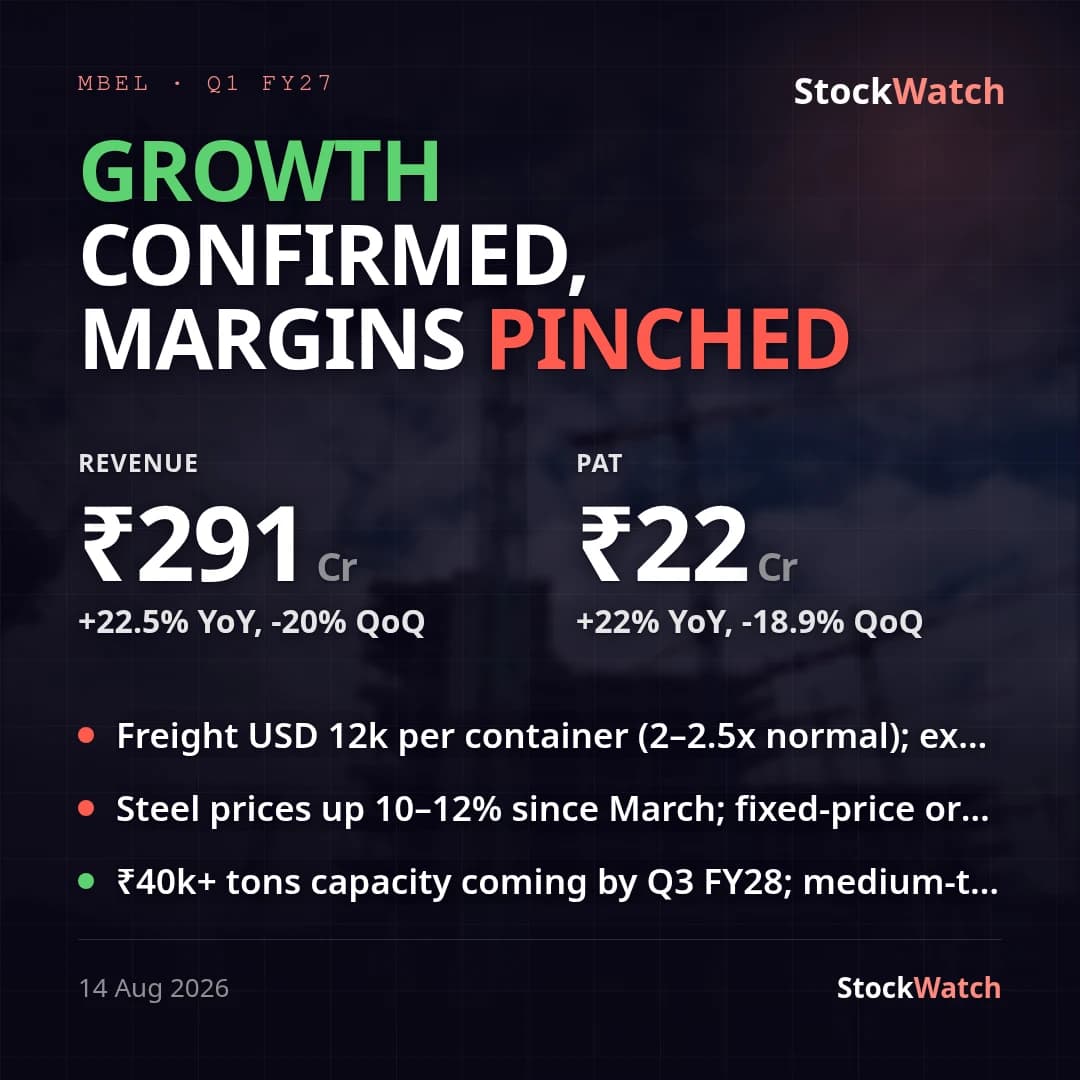
Growth on track, but the 11% margin is why the street is selling

PEB · freight headwinds · margin compression
Result verdictFollow-upQ1 FY2714 Aug 20266 minIndustrials & Infra

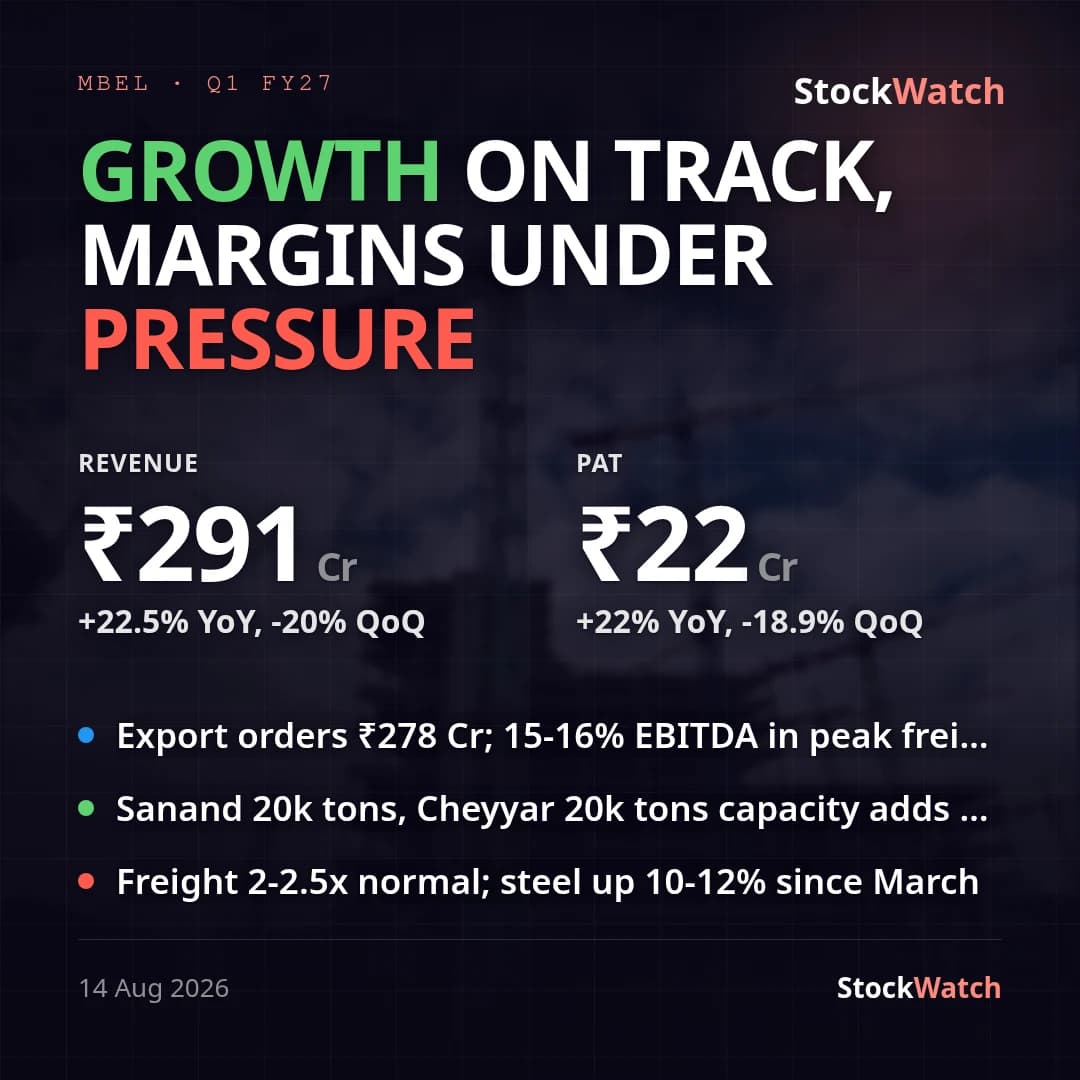
Growth on track; margins squeezed by freight and steel headwinds

capacity expansion · freight cost headwinds · order book strength

TranscriptDeep diveQ1 FY2714 Aug 20266 minIndustrials & Infra

M&B Engineering Q1FY27: consolidated PAT +22% YoY to ₹22 Cr, margins compress as guided

pre-engineered buildings · margin compression · export growth

ResultsQ1 FY2710 Aug 20263 minIndustrials & Infra
Latest

Corporate Events

Board MeetingMBEL
2026
17Sep

Board Meeting

The company is correcting a typographical error regarding th…

BSE Filing ↗
DividendMBEL
2026
10Sep

Dividend

BSE Filing ↗
Board MeetingMBEL
2026
10Aug

Board Meeting

The Board of Directors meeting is scheduled to consider and …

BSE Filing ↗