StockWatch
·

ORBIT EXPORTS LTD.

BSE: 512626

P/L Snapshot

Q2 FY27 · standalone

vs Q1 FY27·vs Q2 FY26
Revenue
88.85
+1.7%+51.7%
Expenditure
64.56
+17.0%+39.7%
Net Profit
18.66
-25.6%+106.8%
OPM %
26.80%
-6.68pp+7.23pp

Shareholding

Pattern breakdown

P/L Trends

(in crores)

RevenueExpenditureNet Profit
0.0024.8849.7674.6499.51Q2 FY25Q3 FY25Q4 FY25Q1 FY26Q2 FY26Q3 FY26Q4 FY26Q1 FY27Q2 FY27
Price Chart
Reports

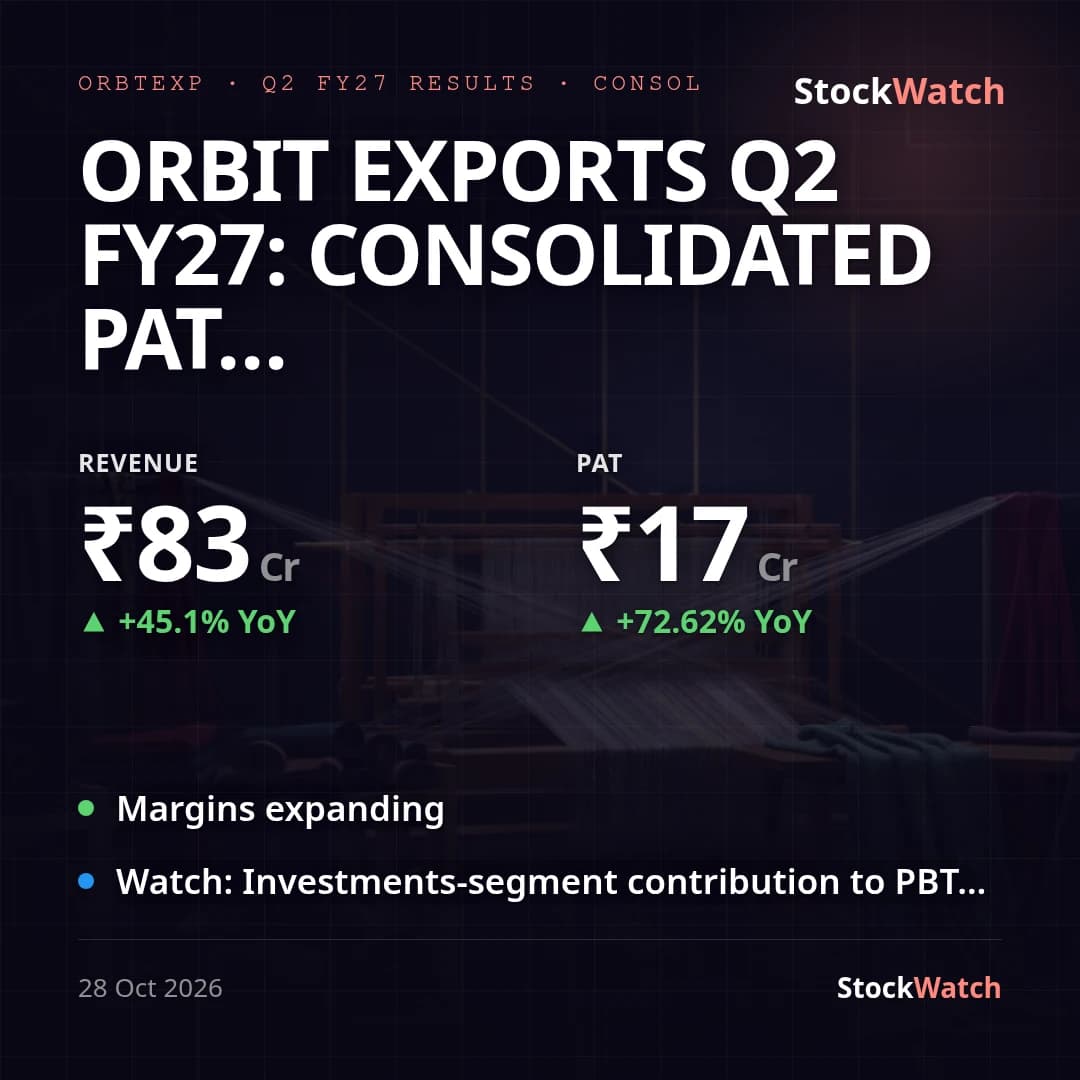
Orbit Exports Q2 FY27: consolidated PAT +73% YoY, but core textile profit up only ~35%

textile exports · investment gains · margin compression

ResultsQ2 FY2728 Oct 20263 minConsumer & Retail

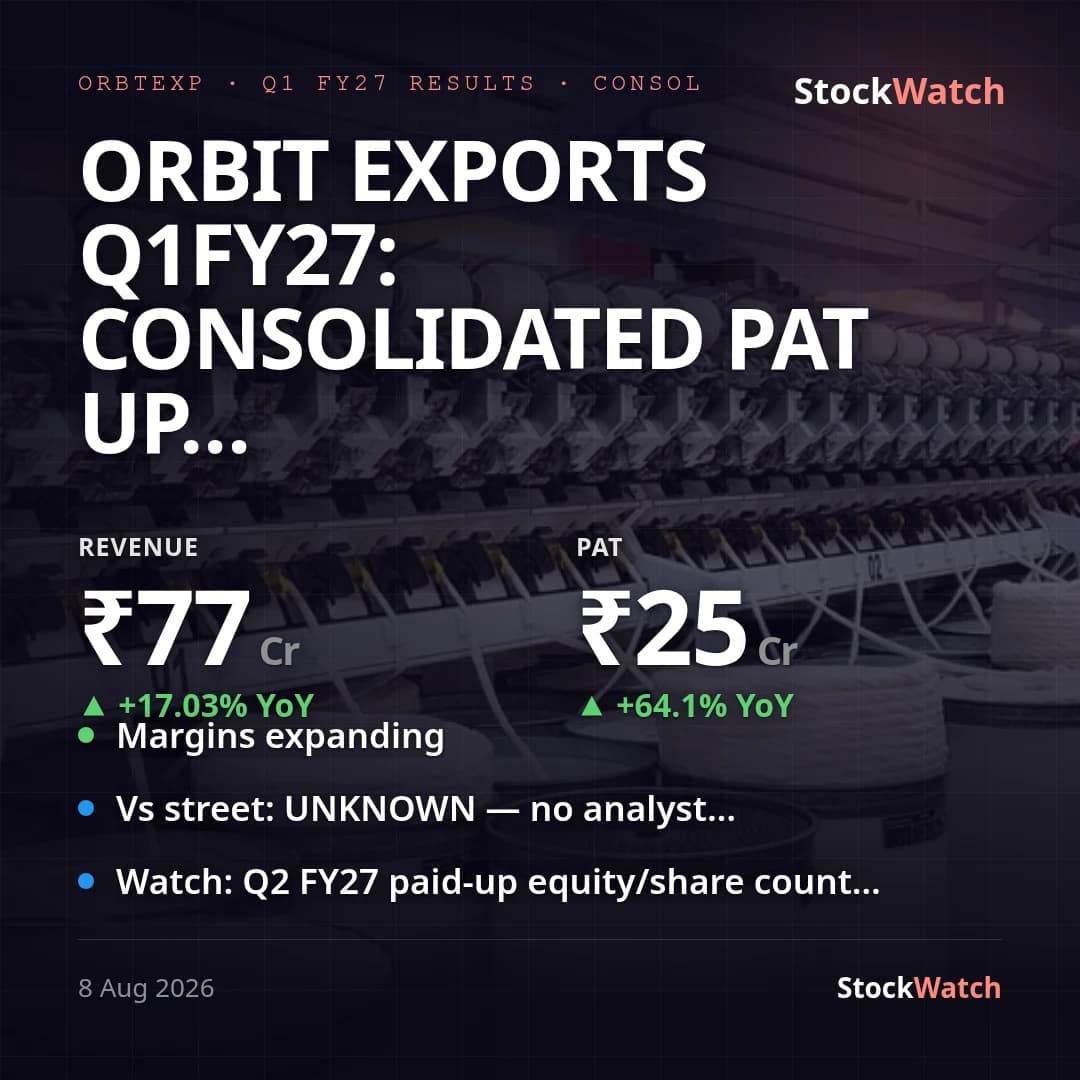
Orbit Exports Q1FY27: consolidated PAT up 64% YoY on textile growth, investment gains

textile exports · margin expansion · investment income

ResultsQ1 FY2708 Aug 20263 minConsumer & Retail
Latest
Board Meeting28 Oct, 4:50 pm

Orbit Exports Q2 FY27: consolidated PAT +73% YoY, but core textile profit up only ~35%

Orbit Exports' consolidated revenue rose 45.1% YoY to ₹82.97 Cr and net profit jumped 72.6% YoY to ₹17.35 Cr in Q2 FY27, extending the recovery seen in Q1 FY27 (PAT +64% YoY per our records). But the headline PAT growth overstates the core business: the Textile segment (the company's only operating segment) grew revenue 34.1% YoY to ₹84.85 Cr and segment PBT 34.6% YoY to ₹18.78 Cr, while roughly half of the YoY PBT increase came from the Investments segment swinging from a ₹0.29 Cr loss a year ago to a ₹4.75 Cr gain now — mark-to-market/fair-value gains on financial instruments, not textile operations. Reported PAT growth of +72.6% is therefore better read as ~+35% on a core, adjusted basis. Sequentially, PAT fell 29.5% QoQ from ₹24.63 Cr even as revenue rose 7.6% QoQ, because cost of materials consumed jumped 19.5% QoQ (₹27.91 Cr to ₹33.36 Cr) well ahead of revenue, compressing the EBITDA margin (OPM) to 24.9% from 32.45% in Q1 and NPM to 19.4% from 28.0%. The Investments segment also normalized QoQ, contributing ₹4.75 Cr versus ₹9.65 Cr in Q1, removing a tailwind that had flattered the prior quarter. Consolidated PAT of ₹17.35 Cr runs about 7% below standalone PAT of ₹18.66 Cr, reflecting subsidiary-level costs against a modest associate-profit contribution — a basis gap worth noting though not a directional disagreement. Management gives no formal forward guidance, none was found via web search, and no analyst consensus or street preview for this quarter turned up either, so vsStreet is unknown; no management press release accompanied this filing. The quarter also saw the ₹22.27 Cr buyback (8,90,822 shares) complete in August, reducing paid-up equity capital by ₹0.89 Cr, following the ₹0.50/share interim dividend declared alongside Q1 results.

28 Oct 2026, 04:50 pm

Board Meeting8 Aug, 4:40 pm

Orbit Exports Q1FY27: consolidated PAT up 64% YoY on textile growth, investment gains

Orbit Exports' consolidated PAT for Q1 FY27 (quarter ended June 30, 2026) was ₹24.63 Cr, up 64.1% year-on-year from ₹15.01 Cr, on consolidated revenue of ₹77.10 Cr, up 17.0% YoY from ₹65.88 Cr. Standalone PAT of ₹25.06 Cr is within ~1.8% of the consolidated figure, so the two statements tell the same story. There is no analyst coverage or consensus estimate on record for this small-cap textile exporter — a search for Q1 FY27 previews turned up no brokerage estimates — so vsStreet is unknown; management has also issued no formal guidance or outlook on this or any prior call, so the print cannot be graded against a stated target. Net margin expanded to 28.0% of total income from 21.2% a year ago, and the EBITDA margin held near 28.7% versus roughly 27.0% YoY. But the growth is unevenly sourced: the core Textile segment's pre-tax result rose a healthy 36.5% YoY to ₹22.32 Cr on segment revenue of ₹78.19 Cr (+15.2% YoY), while the non-operating Investments segment swung from a ₹5.81 Cr loss in Q4 FY26 to a ₹9.65 Cr profit this quarter, and standalone/consolidated Other Income more than doubled YoY to ₹10.82 Cr from ₹3.83 Cr. That investment-book swing — not classified as an exceptional item but visibly volatile quarter to quarter — accounts for a large share of the YoY PAT growth; the QoQ PAT comparison (up over 24x) is not meaningful since Q4 FY26's Investments segment loss pulled that quarter's PAT down to a near-breakeven ₹0.995 Cr. The result lands alongside two other board actions taken the same day: a 1st interim dividend of 5% (₹0.50/share) for FY27, and confirmation that the company completed ₹22.27 Cr of its ₹27.6 Cr buyback (8,90,822 shares at ₹250/share) on August 3, 2026 — after the June 30 quarter-end, so this quarter's paid-up capital (₹26.51 Cr) still reflects the pre-buyback share count; the reduction will show up from Q2 FY27 onward. No prior-quarter concall commentary or management press release accompanies this filing.

8 Aug 2026, 04:40 pm

Corporate Events

Board MeetingORBTEXP
2026
28Oct

Board Meeting

The meeting of the Board of Directors is scheduled to consid…

BSE Filing ↗
Board MeetingORBTEXP
2026
29Sep

Board Meeting

The 43rd Annual General Meeting (AGM) is scheduled to be hel…

BSE Filing ↗
DividendORBTEXP
2026
31Aug

₹0.5 / share

BSE Filing ↗
Board MeetingORBTEXP
2026
8Aug

Board Meeting

The meeting of the Board of Directors is scheduled to consid…

BSE Filing ↗
Board MeetingORBTEXP
2026
7Jul

Board Meeting

The Board of Directors meeting is scheduled to consider and …

BSE Filing ↗
Board MeetingORBTEXP
2025
29Apr

Board Meeting

Consider and approve Audited Financial Results

BSE Filing ↗
Board MeetingORBTEXP
2025
7Feb

Board Meeting

Consider and approve Intimation of Board Meeting, consider a…

BSE Filing ↗
Board MeetingORBTEXP
2024
22Oct

Board Meeting

Unaudited Financial Results, Consider and approve

BSE Filing ↗
Board MeetingORBTEXP
2024
6May

Board Meeting

Consider and approve the Audited Financial Results of the Co…

BSE Filing ↗
Board MeetingORBTEXP
2024
1Feb

Board Meeting

Consider and approve Unaudited Financial Results for quarter…

BSE Filing ↗
Board MeetingORBTEXP
2023
7Nov

Board Meeting

Consider and approve Un-audited Financial Results for Quarte…

BSE Filing ↗