StockWatch
·

SIL INVESTMENTS LTD.

BSE: 521194

P/L Snapshot

Q2 FY27 · standalone

vs Q1 FY27·vs Q2 FY26
Revenue
32.72
+128.7%+45.8%
Expenditure
3.02
+33.0%+29.1%
Net Profit
24.96
+100.2%+59.1%
OPM %
92.51%
+4.46pp+0.40pp

Shareholding

Pattern breakdown

P/L Trends

(in crores)

RevenueExpenditureNet Profit
-8.622.8214.2725.7137.15Q2 FY19Q3 FY19Q4 FY19Q4 FY25Q1 FY26Q2 FY26Q3 FY26Q4 FY26Q1 FY27Q2 FY27
Price Chart
Reports

Consolidated PAT up 47% YoY to ₹29.2 Cr on dividend timing, portfolio gains

nbfc investment company · dividend income · portfolio gains

ResultsQ2 FY2730 Oct 20263 minFinancial Services

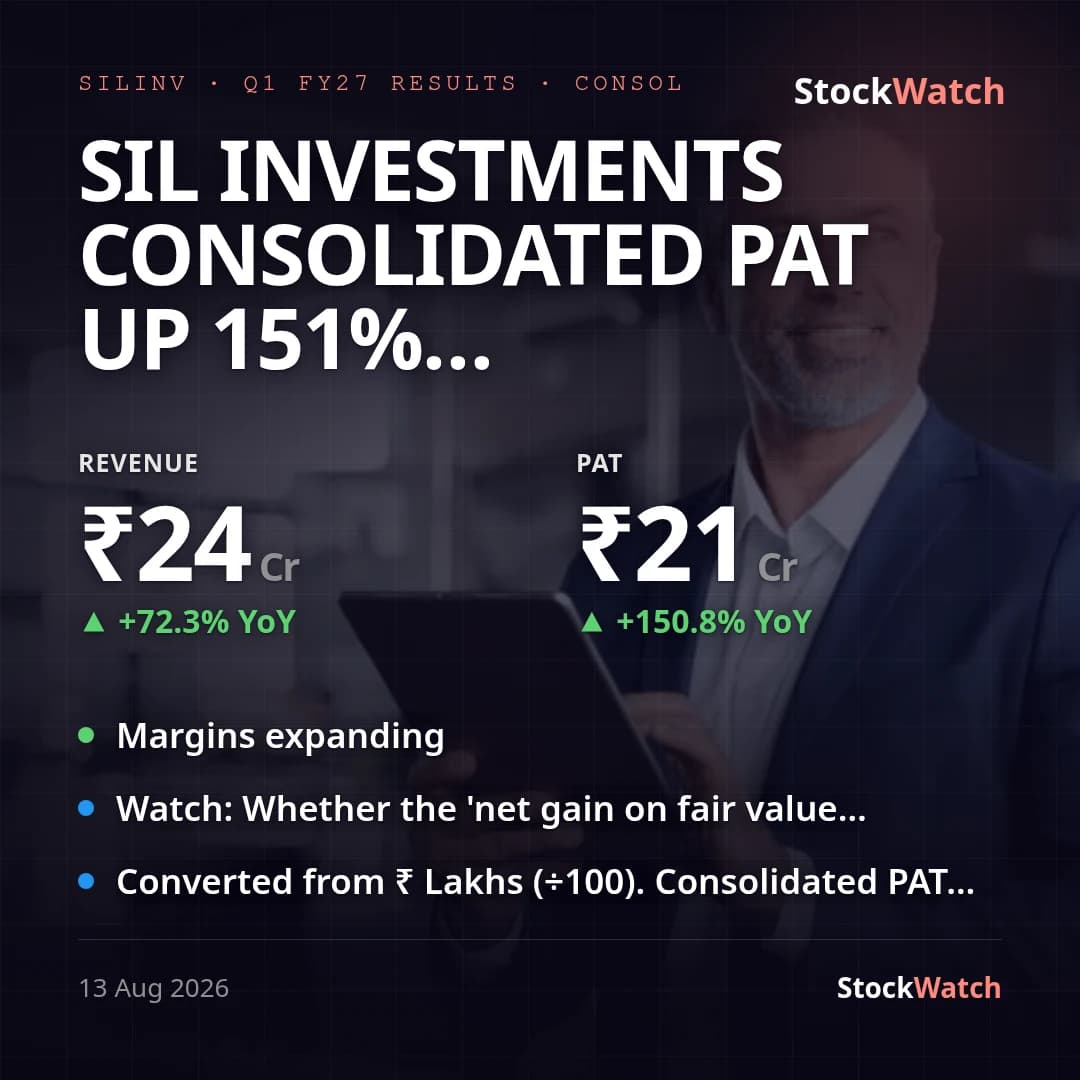
SIL Investments consolidated PAT up 151% YoY to ₹20.5 Cr on stronger portfolio gains

nbfc · investment company · mark-to-market gains

ResultsQ1 FY2713 Aug 20263 minFinancial Services
Latest
Quarterly Result30 Oct, 1:05 pm

Consolidated PAT up 47% YoY to ₹29.2 Cr on dividend timing, portfolio gains

SIL Investments, an NBFC investment-holding company of the Nopany group, posted consolidated PAT (profit for the period, before minority interest) of ₹29.20 Cr for Q2 FY27, up 47.4% year-on-year from ₹19.81 Cr and up 42.2% sequentially from ₹20.54 Cr. Of this, ₹28.76 Cr is attributable to owners and ₹0.44 Cr to non-controlling interests in subsidiaries (RTM Investment & Trading, SCM Investment & Trading, SIL Properties, RTM Properties and Singapore-based SIL International Pte). Consolidated total income rose 36.6% YoY and 66.4% QoQ to ₹39.53 Cr. The growth is driven almost entirely by the two lines core to this company's business model rather than by any operating expansion: dividend income of ₹29.74 Cr (vs ₹25.00 Cr a year ago and just ₹0.28 Cr last quarter) and net gains on fair-value changes in its investment portfolio of ₹5.77 Cr (vs ₹0.71 Cr a year ago). The company's own note explicitly flags that the current quarter's dividend receipts make the results non-representative of the full year — Q2 is structurally the heaviest dividend quarter in SIL's annual cycle (it was similarly large, ₹25.00 Cr, in Q2 FY26) — so the 66% QoQ income jump versus a dividend-light Q1 is largely a seasonal artifact, and the YoY comparison is the more meaningful read. Pre-tax margin expanded on both bases (YoY 88.8%→90.0%, QoQ 87.7%→90.0%), but net margin fell to 73.9% from 86.5% QoQ because the effective tax rate normalized to ~18.0% from an unusually low ~1.4% in Q1 FY27 — that low Q1 rate, not a Q2 deterioration, is the real driver of the sequential net-margin dip. YoY net margin still expanded (68.4%→73.9%) since last year's effective tax rate (~23.0%) was higher than this quarter's ~18.0%. Standalone (parent-only) PAT of ₹24.96 Cr, up from ₹15.69 Cr YoY, moves in the same direction, so the consolidated and standalone prints are not materially divergent this quarter. Management has issued no formal guidance or outlook with this result, and our records hold no prior guidance or concall commentary to grade this quarter against. A web search turned up no street/analyst coverage or consensus estimates for this print — SIL Investments is a micro-cap NBFC without tracked analyst estimates, so vsStreet is unknown rather than a beat or miss.

30 Oct 2026, 01:05 pm

Board Meeting13 Aug, 1:08 pm

SIL Investments consolidated PAT up 151% YoY to ₹20.5 Cr on stronger portfolio gains

SIL Investments, an RBI-registered 'Middle Layer' NBFC whose sole reportable segment is investment and financing activities, reported consolidated total income of ₹23.75 Cr and PAT of ₹20.54 Cr (owner's share ₹20.22 Cr, NCI ₹0.32 Cr) for Q1 FY27, up roughly 72% and 151% YoY from ₹13.67 Cr revenue and ₹8.19 Cr PAT a year ago. Standalone PAT was ₹12.47 Cr against ₹4.80 Cr YoY (EPS ₹11.77), broadly tracking the consolidated growth rate — standalone and consolidated tell a consistent story this quarter, no material divergence. No brokerage previews or consensus estimates for this micro-cap NBFC turned up in a web search, so vsStreet is unknown; the company also carries no formal earnings guidance on record, so the print cannot be benchmarked against a prior management outlook either. The growth was driven almost entirely by 'net gain on fair value changes' — mark-to-market gains on the company's equity/investment book — which rose to ₹19.41 Cr consolidated (₹10.69 Cr standalone) from ₹8.13 Cr (₹4.88 Cr standalone) a year ago, while interest and dividend income were roughly flat and total expenses actually fell slightly YoY (₹2.92 Cr vs ₹3.18 Cr consolidated). That combination pushed consolidated net profit margin to about 86.5% of total income from 59.9% a year ago. Because this line is volatile, Q4FY26 (quarter to 31 March 2026) saw a fair-value LOSS that dragged both revenue from operations (-₹5.64 Cr) and consolidated PAT (-₹9.46 Cr) negative — so this quarter's headline growth is as much a reversal of that mark-to-market swing as organic growth, and a QoQ read off that loss base is not meaningful. No management press release accompanied the filing beyond the standard board-outcome letter, so there is no separate management commentary to reconcile against the numbers. The quarter's other corporate developments — the 92nd AGM held 31 July 2026, the FY26 annual report, and a dividend with 24 July 2026 record date — are routine and don't bear directly on this quarter's P&L. The results are un-audited with only a limited review (SRE 2410); auditors for both statements flagged, as a standard 'Other Matter', that the Q4FY26 comparative figures are balancing figures rather than independently reported numbers, and the consolidated auditor relied on other auditors'/management-certified figures for two India step-down subsidiaries and the Singapore subsidiary.

13 Aug 2026, 01:08 pm

Corporate Events

Board MeetingSILINV
2026
30Oct

Board Meeting

The meeting of the Board of Directors of the Company will be…

BSE Filing ↗
Board MeetingSILINV
2026
13Aug

Board Meeting

The meeting of the Board of Directors of the Company will be…

BSE Filing ↗
Board MeetingSILINV
2026
31Jul

Board Meeting

The Ninety Second (92nd) Annual General Meeting (‘AGM’) of t…

BSE Filing ↗
DividendSILINV
2026
24Jul

₹2.5 / share

BSE Filing ↗
Board MeetingSILINV
2026
12May

Board Meeting

The Board of Directors meeting was held on May 12, 2026. Th…

BSE Filing ↗
Board MeetingSILINV
2024
12Nov

Board Meeting

Consider and approve the Un-Audited Financial Results for th…

BSE Filing ↗
Board MeetingSILINV
2024
10May

Board Meeting

consider and approve the Audited Financial Results (Standalo…

BSE Filing ↗
Board MeetingSILINV
2024
14Feb

Board Meeting

Consideration and approval of Un-Audited Financial Results (…

BSE Filing ↗
Board MeetingSILINV
2023
10Nov

Board Meeting

Consideration and approval of Un-Audited Financial Results f…

BSE Filing ↗
Board MeetingSILINV
2023
14Aug

Board Meeting

Considering and approving Un-Audited Financial Results for t…

BSE Filing ↗