CMS Info Q1FY27: PAT down 10.6% YoY on depreciation surge despite record services revenue
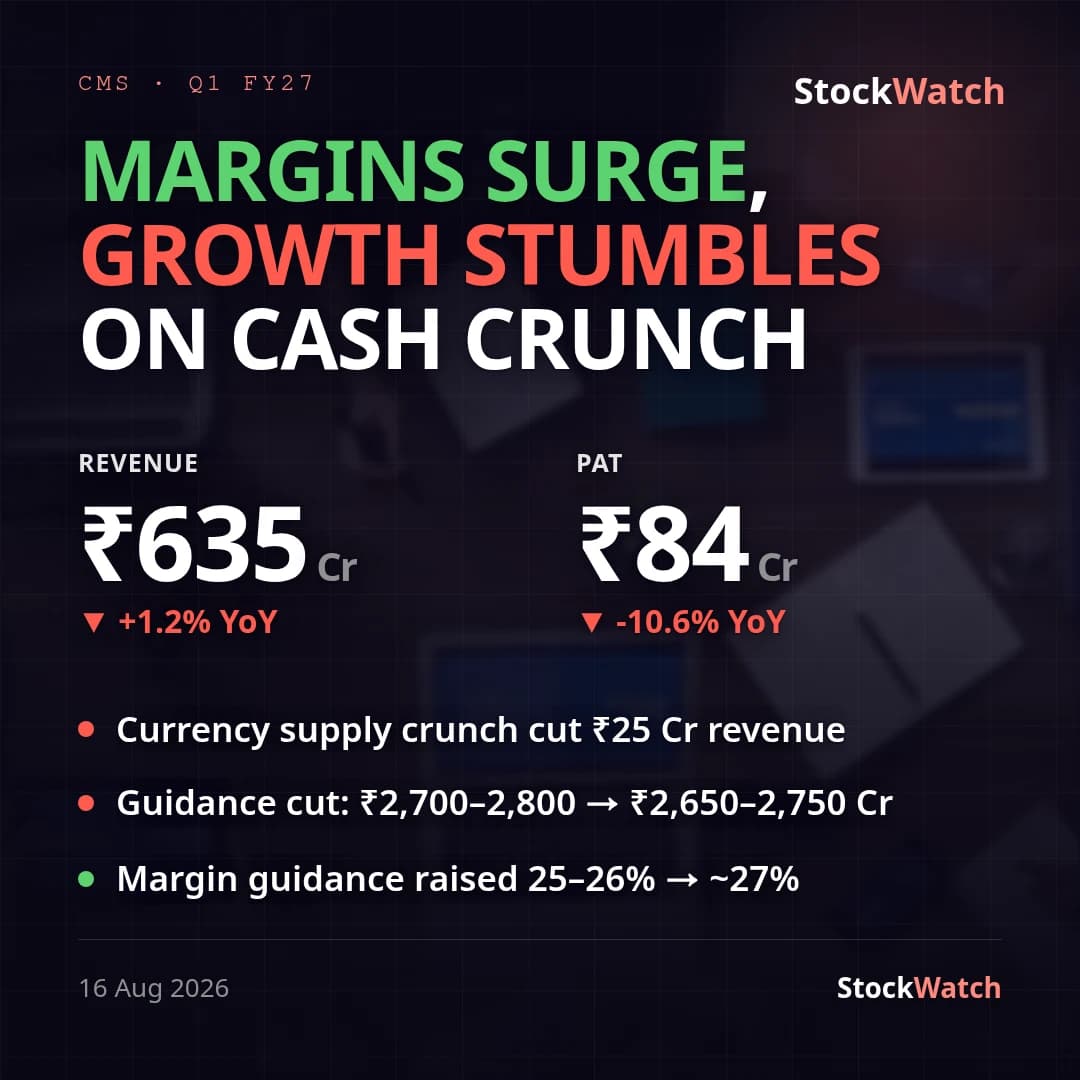
CMS Info Systems reported consolidated revenue of ₹634.7 Cr (+1.2% YoY, +0.3% QoQ) and PAT of ₹83.7 Cr (-10.6% YoY, +5.8% QoQ) for Q1 FY27, with basic EPS of ₹5.10 versus ₹5.69 a year ago and ₹4.81 last quarter. Standalone tells a very different story — PAT up 39.1% YoY to ₹117.0 Cr — but that jump is inflated by a one-off ₹49.0 Cr dividend from subsidiaries booked in standalone other income and eliminated on consolidation; the consolidated print, which is primary, is the one that matters for judging the quarter.
Total revenue growth was muted because Cash Logistics (63% of segment revenue) fell 3% YoY to ₹403 Cr, which management tied to "the sharpest currency-supply disruption in a decade" hitting ATM transaction volumes in a seasonally weak quarter. Managed Services & Technology Solutions (incl. Card Services) grew 18% YoY to ₹305 Cr, pushing services revenue to a record ₹625 Cr (+9.3% YoY, +2.6% QoQ). Operating performance was genuinely strong — EBITDA of ₹173 Cr (+8.9% YoY) lifted margin to 27.2%, up from roughly 25.2% a year ago and 25.8% last quarter — but none of that reached the bottom line: depreciation jumped 63% YoY to ₹72.8 Cr and finance costs rose 51% YoY to ₹6.2 Cr, both a function of two years of technology capex. Segment EBIT shows exactly where: Managed Services EBIT fell 13% YoY (24% QoQ) to ₹32 Cr even as its revenue grew, which the company's own footnote attributes to "lower BLA transaction revenue and a higher depreciation charge." A lower effective tax rate (20.3% vs 25.5% a year ago) cushioned but didn't offset the decline.
We found no quarter-specific street estimate to grade the print against. Trendlyne's FY27 consensus (4 analysts) pencils in ~12.5% revenue growth and ~22.7% profit growth for the full year — a bar this quarter's YoY numbers (+1.2% revenue, -10.6% PAT) sit well below, though one quarter isn't the full-year run-rate. Against management's own Q4 FY26 guidance — FY27 services revenue of ₹2,700-2,800 Cr (17-21% growth, 85%-visible pipeline) and a 25% EBITDA margin target — the quarter is split: EBITDA margin (27.2%) already runs ahead of the 25% target, but services revenue growth of 9.3% YoY trails the low end of the guided range. Management framed the quarter as resilient given the currency-supply shock, crediting two years of technology investment, pricing discipline and a more flexible workforce — a claim the margin data partly supports and the PAT decline partly complicates.
The quarter closed alongside completion of the ₹167.93 Cr buyback (4,939,126 shares at ₹340, settled and extinguished by June 19, 2026), which drew down share premium and retained earnings and cut paid-up capital to ₹160.06 Cr from ₹164.64 Cr a year ago. New order wins of ~₹500 Cr — the HDFC Bank integrated managed-services mandate, ~1,000 currency-recycler mandates with PSU banks, and two PSU wins for the HAWKAI and ALGO platforms — give the Managed Services segment forward revenue visibility, though that segment's revenue growth (+18% YoY) is not yet converting into EBIT growth. Two independent-director appointments disclosed alongside results are governance items unrelated to the print.