StockWatch
·

Concord Biotech Ltd

BSE: 543960

P/L Snapshot

Q1 FY27 · standalone

vs Q3 FY26·vs Q1 FY26
Revenue
273.61
-5.1%+25.7%
Expenditure
191.40
-1.7%+19.3%
Net Profit
61.19
-9.7%+43.8%
OPM %
33.46%
-2.11pp+3.36pp

Shareholding

Pattern breakdown

P/L Trends

(in crores)

RevenueExpenditureNet Profit
0.00122.99245.99368.98491.98Q2 FY25Q3 FY25Q4 FY25Q1 FY26Q2 FY26Q3 FY26Q1 FY27
Price Chart
Reports

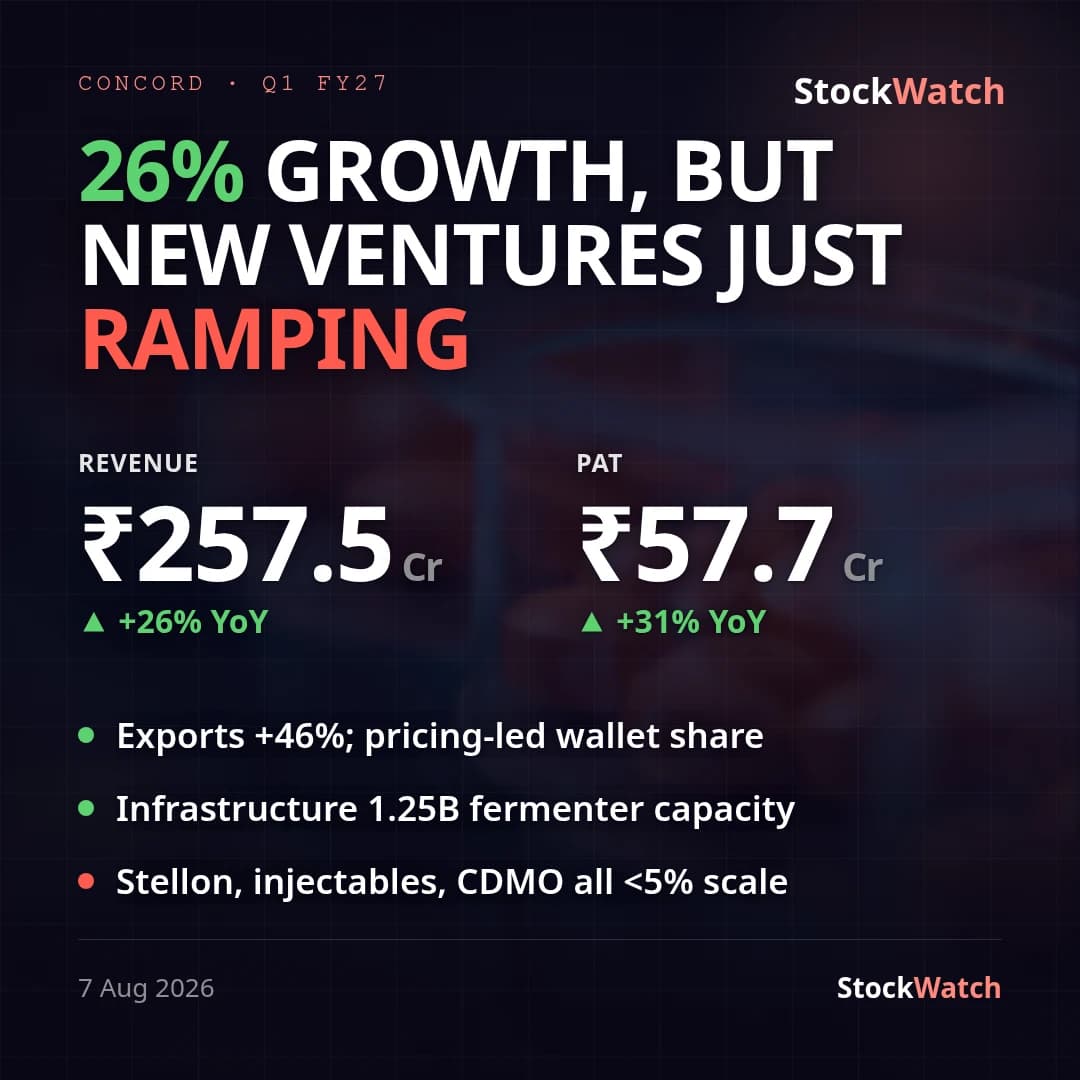
Strong 26% growth, margin expansion; long-term bets ramping slower than guided

export momentum 46% · pricing power · injectable facility 5% util.

TranscriptDeep diveQ1 FY2707 Aug 20266 minPharma & Healthcare

Concord Biotech's Q1 marks return to growth: consol PAT +31% YoY to ₹58 Cr, margins expand

pharmaceuticals · api · revenue rebound

ResultsQ1 FY2731 Jul 20263 minPharma & Healthcare
Latest
Board Meeting31 Jul, 6:20 pm

Concord Biotech's Q1 marks return to growth: consol PAT +31% YoY to ₹58 Cr, margins expand

Concord Biotech opened FY27 with a clear rebound after a soft FY26. Q1 consolidated revenue from operations rose 26.2% YoY to ₹257.5 Cr and net profit (attributable to owners) rose ~33% to ₹58.5 Cr (₹57.7 Cr PAT for the period after a ₹0.8 Cr non-controlling loss), against ₹204.0 Cr and ₹44.1 Cr a year ago. Margins moved the right way on both lines: operating margin expanded to ~32.0% from 30.1%, and net margin to ~22.7% from 20.2%, with the print carrying no exceptional items this quarter — so the reported growth is the underlying growth, not an optics effect. EPS was ₹5.52 vs ₹4.21. The result validates management's own guidance from the Q3 FY26 concall, where it flagged FY26 as below historical averages but guided FY27 back toward historical growth with potential acceleration to a ~25% CAGR as the injectable facility, CDMO partnerships and new launches scale. A 26% YoY topline in the very first quarter sits squarely on that path. The margin recovery also aligns with management's claim that core business margins remain stable (~40% at the core level) even as new ventures carry start-up costs — the consolidated drag from those ventures is visible in the standalone-vs-consolidated gap: standalone PAT grew 43.8% YoY (to ₹61.2 Cr) versus 31% consolidated, because loss-making subsidiaries (Celliimune, acquired Apr 2, 2026; Stellon Biotech) dilute the group number. Readers seeing the higher standalone figure elsewhere should treat consolidated as the true group picture. Against the sequential quarter, revenue fell 21% and PAT 35% versus Q4 FY26 (₹326 Cr / ₹88.5 Cr), but Q4 is seasonally Concord's strongest quarter and that step-down is a seasonality artifact, not a deterioration — the YoY comparison is the signal here. Concurrent developments support the recovery read: Unit-II cleared Kenya and Uganda regulatory inspections in June, and the board declared the quarter alongside a final dividend (July 24 record date) and the 41st AGM. No formal quarterly guidance or published street consensus was available for this print; the FY26 base had seen consolidated revenue decline ~12%, so this quarter is the first concrete evidence of the guided turnaround taking hold. Management will detail the recovery on its August 3 earnings call.

31 Jul 2026, 06:20 pm

Corporate Events

Board MeetingCONCORDBIO
2026
31Jul

Board Meeting

The 41st Annual General Meeting (AGM) of the Company is sche…

BSE Filing
DividendCONCORDBIO
2026
24Jul

Dividend

BSE Filing
DividendCONCORDBIO
2026
24Jul

₹7.55 / share

BSE Filing
Board MeetingCONCORDBIO
2026
29May

Board Meeting

To consider and approve the audited Standalone and Consolida…

BSE Filing
Board MeetingCONCORDBIO
2024
11Nov

Board Meeting

Approve The Standalone And Consolidated Unaudited Financial …

BSE Filing
DividendCONCORDBIO
2024
22Jun

₹8.75 / share

BSE Filing