StockWatch
·

CSM Technologies Ltd

BSE: 544806

P/L Snapshot

Q1 FY27 · standalone

vs Q4 FY26
Revenue
41.01
-30.6%
Expenditure
51.36
+12.3%
Net Profit
-7.78
-192.8%
OPM %
-18.65%

Shareholding

Pattern breakdown

P/L Trends

(in crores)

RevenueExpenditureNet Profit
-15.814.9325.6746.4167.15Q4 FY26Q1 FY27
Price Chart
Reports

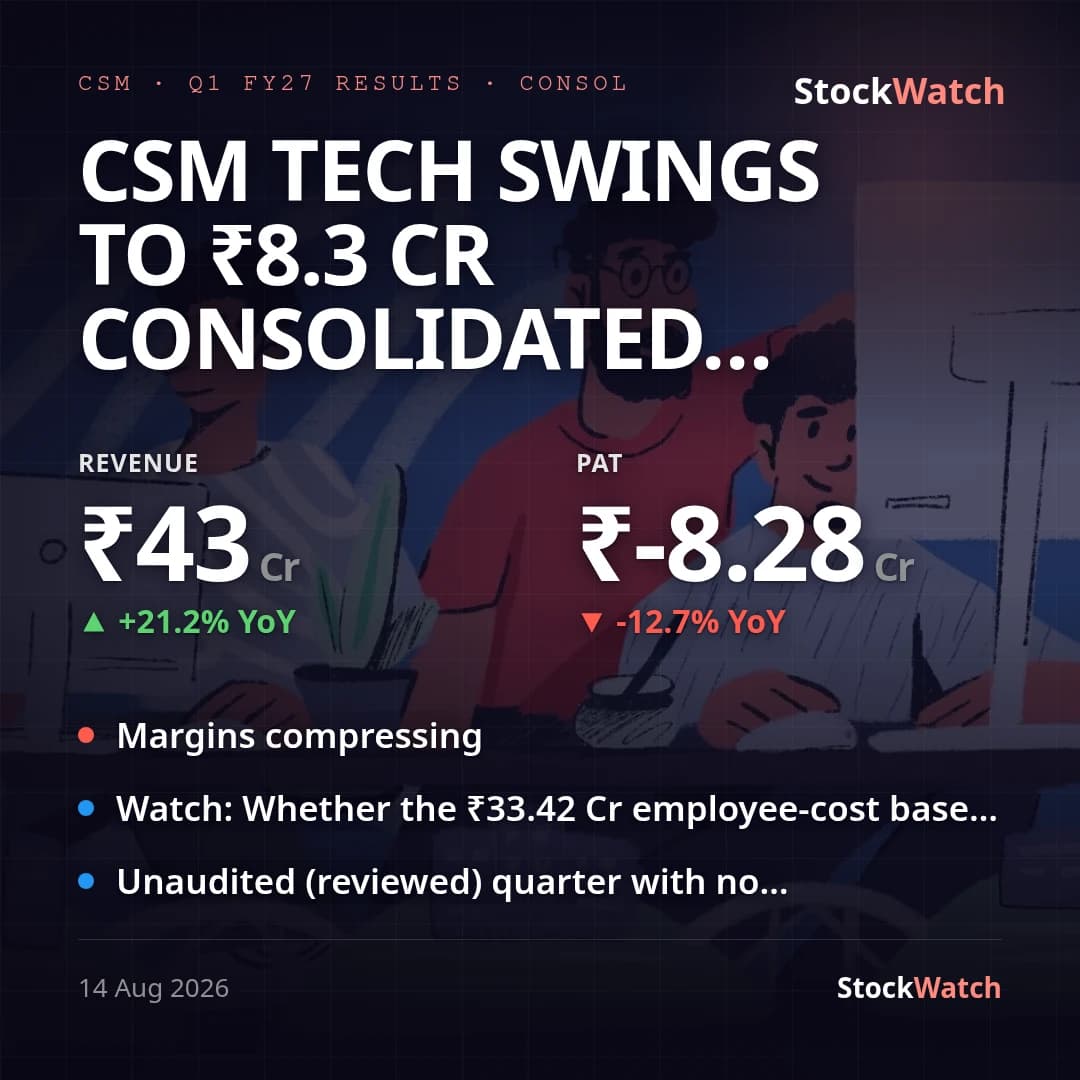
CSM Tech swings to ₹8.3 Cr consolidated loss in Q1 FY27 as employee costs jump 37% YoY

it services · ipo · net loss

ResultsQ1 FY2714 Aug 20263 min

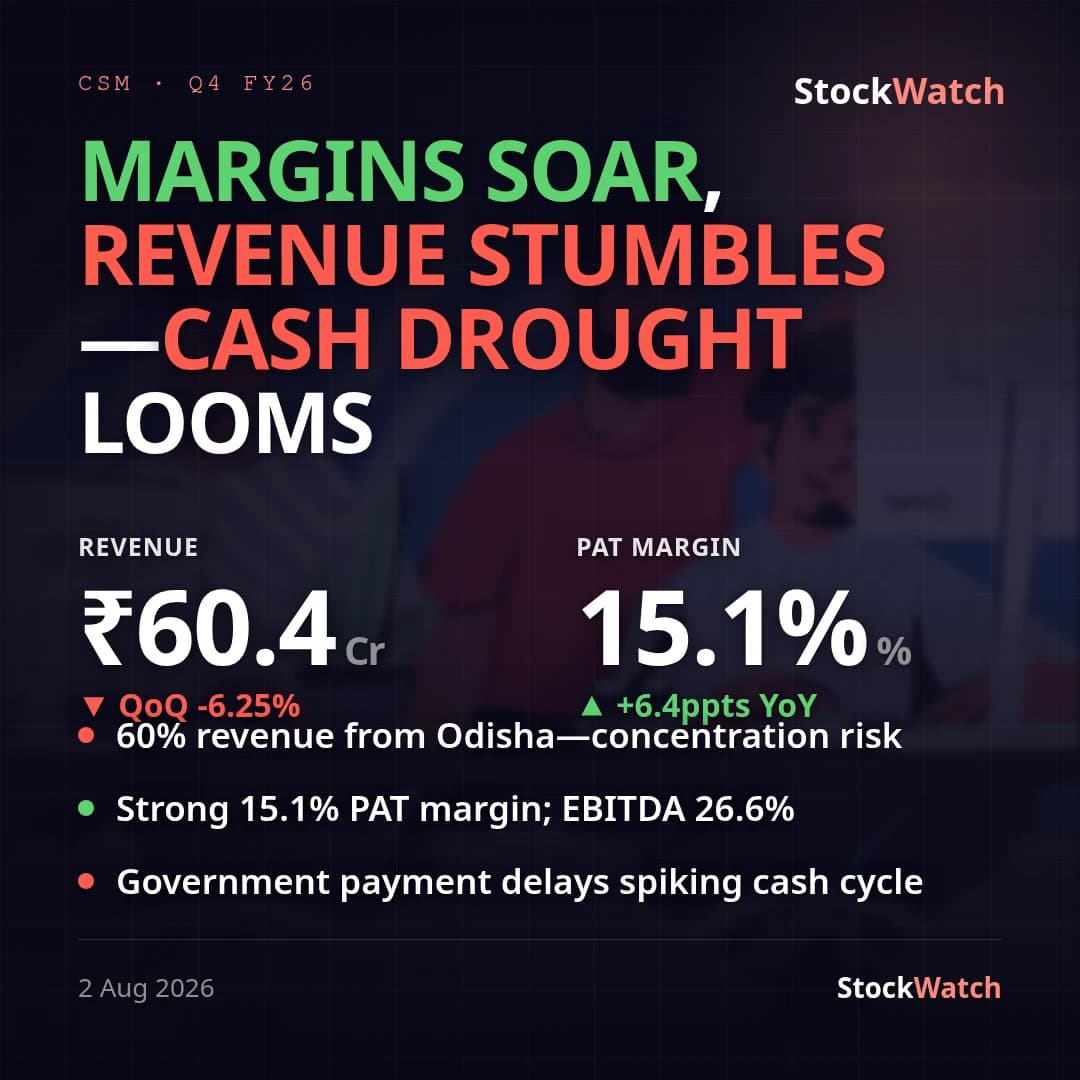
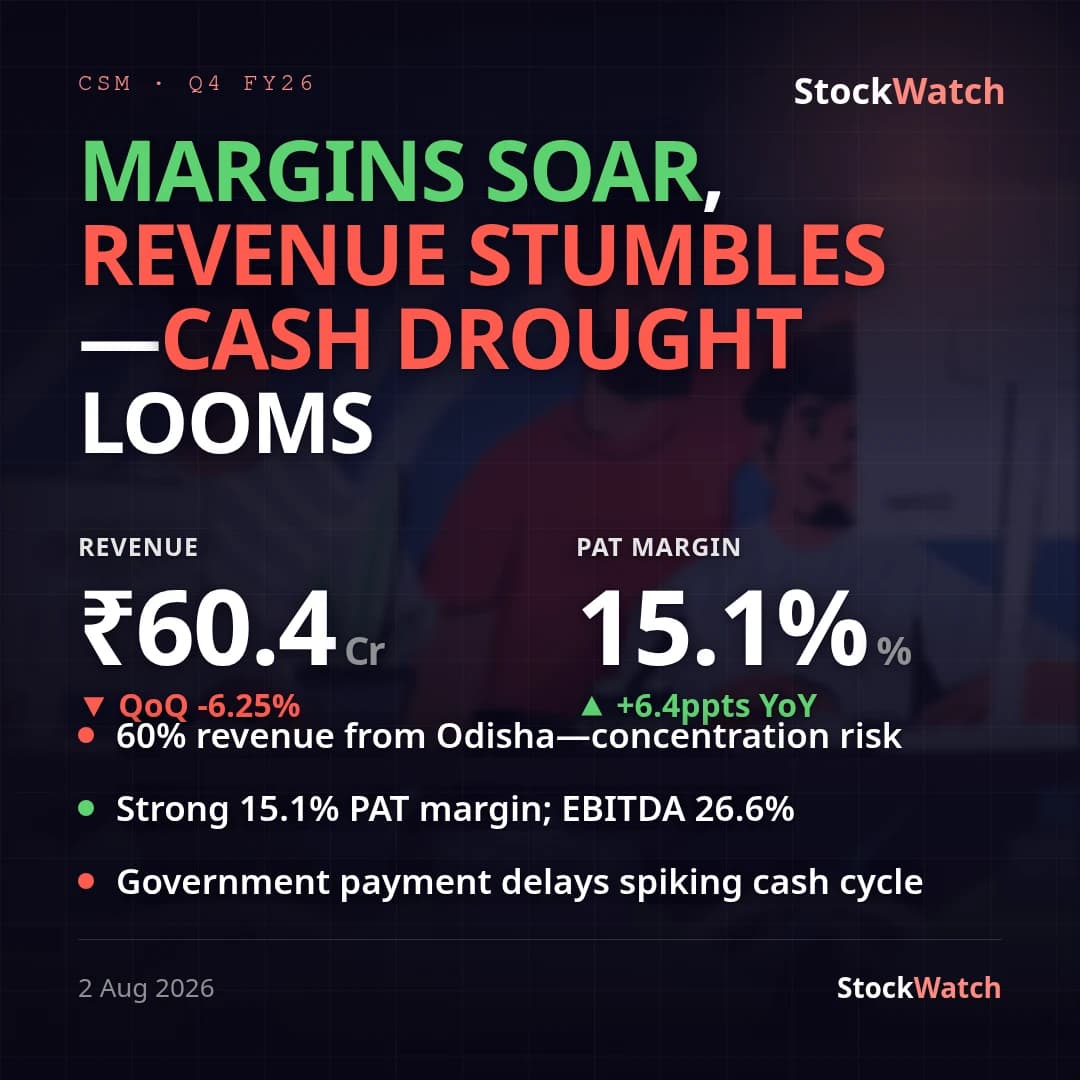
Strong Margins, Drowning in Receivables

govtech · working-capital-strain · odisha-concentration
Result verdictFollow-upQ4 FY2602 Aug 20266 min

Margin expansion masks revenue stall; DSO and concentration pose headwinds

GovTech · margin expansion · order book visibility

TranscriptDeep diveQ4 FY2602 Aug 20266 min
Latest
Board Meeting21 Jul, 7:30 am

CSM Tech Q4 FY26: consolidated PAT +78% YoY to ₹9.3 Cr on sharp margin gains, revenue flat

CSM Technologies' first result print since its 2-Jul-2026 NSE/BSE listing shows a margin-led beat, not a volume-led one. Consolidated PAT rose 77.7% YoY to ₹9.30 Cr (₹5.23 Cr) even as revenue from operations grew just 1.3% YoY to ₹60.43 Cr — and that PAT growth is understated: the quarter absorbed a one-off ₹2.73 Cr exceptional charge for new labour-code gratuity/leave provisioning that didn't exist a year ago. Stripping that out, PBT-before-exceptional was ₹14.17 Cr against ₹9.30 Cr reported PAT's base, implying adjusted PAT growth closer to ~130% YoY. EBITDA (computed from the filing: total income − total expenses + finance cost + D&A) came to ₹16.41 Cr, up 56% YoY, with margin expanding ~911bps to 26.6% — corroborated by independent press coverage of the same filing. The driver sits squarely on the cost line: Cost of Service Rendered fell 39.9% YoY (₹19.76 Cr to ₹11.88 Cr) even as Employee Benefits rose 11.5% YoY, suggesting reduced reliance on third-party/subcontracted service costs rather than any pricing or volume tailwind — flat topline growth means this is a cost-structure story this quarter, not a demand story. Standalone tells a materially different tale: parent-only revenue actually declined 2.2% YoY to ₹57.65 Cr, even though standalone PAT still rose 44.3% YoY to ₹8.38 Cr on the same cost discipline. The >3pt divergence between standalone (revenue down) and consolidated (revenue up) growth is attributable to the profitable Kwantify Solutions subsidiary (acquired June 2025, consolidated net profit ₹4.22 Cr per the auditor's Other Matters note) now being folded into group numbers — readers comparing the two bases should not read the standalone softness as a data error. There is no management guidance on record in our database or the filing itself, and no analyst/consensus estimate for this print turned up in a web search (searches returned only post-release recaps, not pre-release previews) — so vs-street and vs-guidance are both genuinely unknown, not omitted. QoQ, revenue dipped 6.5% (₹64.63 Cr in Dec-25 quarter) but PAT still rose 7.3% sequentially on the same margin trend. Full-year FY26 consolidated PAT closed at ₹24.01 Cr, up 70.2%, alongside a ₹0.50/share final dividend recommendation (on top of an interim ₹0.60/share already paid this year) — both already captured in our event records. The auditor's unmodified opinion carries an emphasis-of-matter on going-concern doubt at CSM Technologies Inc. (USA) and CSM Tech Corp (Canada), both loss-making with negative net worth; the Holding Company has committed financial support and the auditor did not modify its opinion on this basis.

21 Jul 2026, 07:30 am

Corporate Events

Board MeetingCSM
2026
14Aug

Board Meeting

To consider and approve the quarterly un-audited financial r…

BSE Filing
Board MeetingCSM
2026
20Jul

Board Meeting

To consider and approve the Audited Standalone & Consolidate…

BSE Filing
Board MeetingCSM
2025
12Aug

Board Meeting

The Board of Directors approved and adopted the "Code of Pra…

BSE Filing