StockWatch
·

Hexaware Technologies Ltd

BSE: 544362

P/L Snapshot

Q1 FY2027 · standalone

vs Q4 FY2026
Revenue
2.0K
+3.7%
Expenditure
1.8K
+5.5%
Net Profit
200.00
-6.5%
OPM %
18.06%
+0.39pp

Shareholding

Pattern breakdown

P/L Trends

(in crores)

RevenueExpenditureNet Profit
0.001.8K3.5K5.3K7.1KQ1 FY2025Q3 FY2025Q4 FY2025Q1 FY2025Q1 FY2026Q2 FY2025Q2 FY2026Q3 FY2026Q4 FY2026Q1 FY2027

Price Chart

Latest News

Board Meeting29 Jul, 9:10 pm

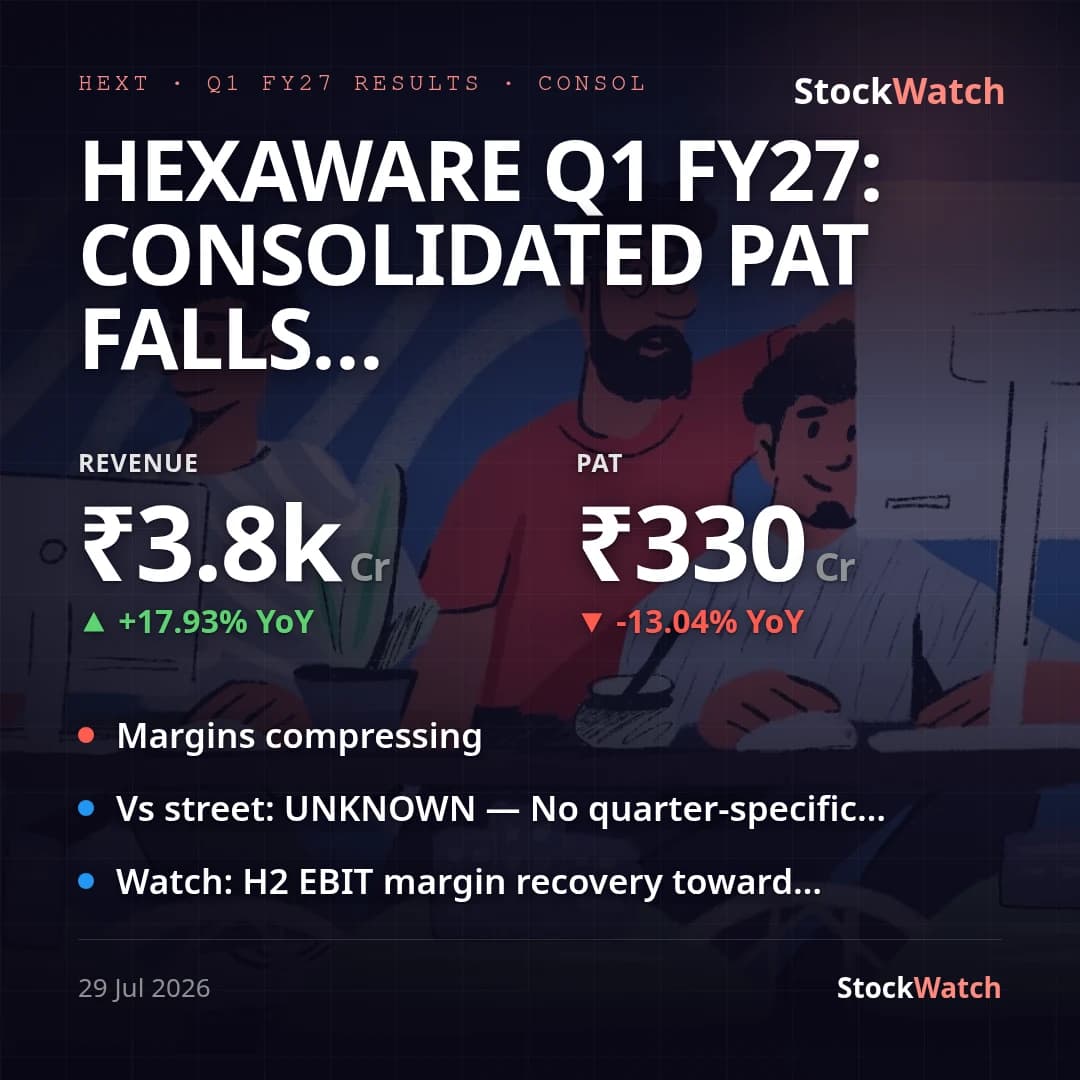
Hexaware Q1 FY27: consolidated PAT falls 13% YoY (~17% adjusted) as margins compress

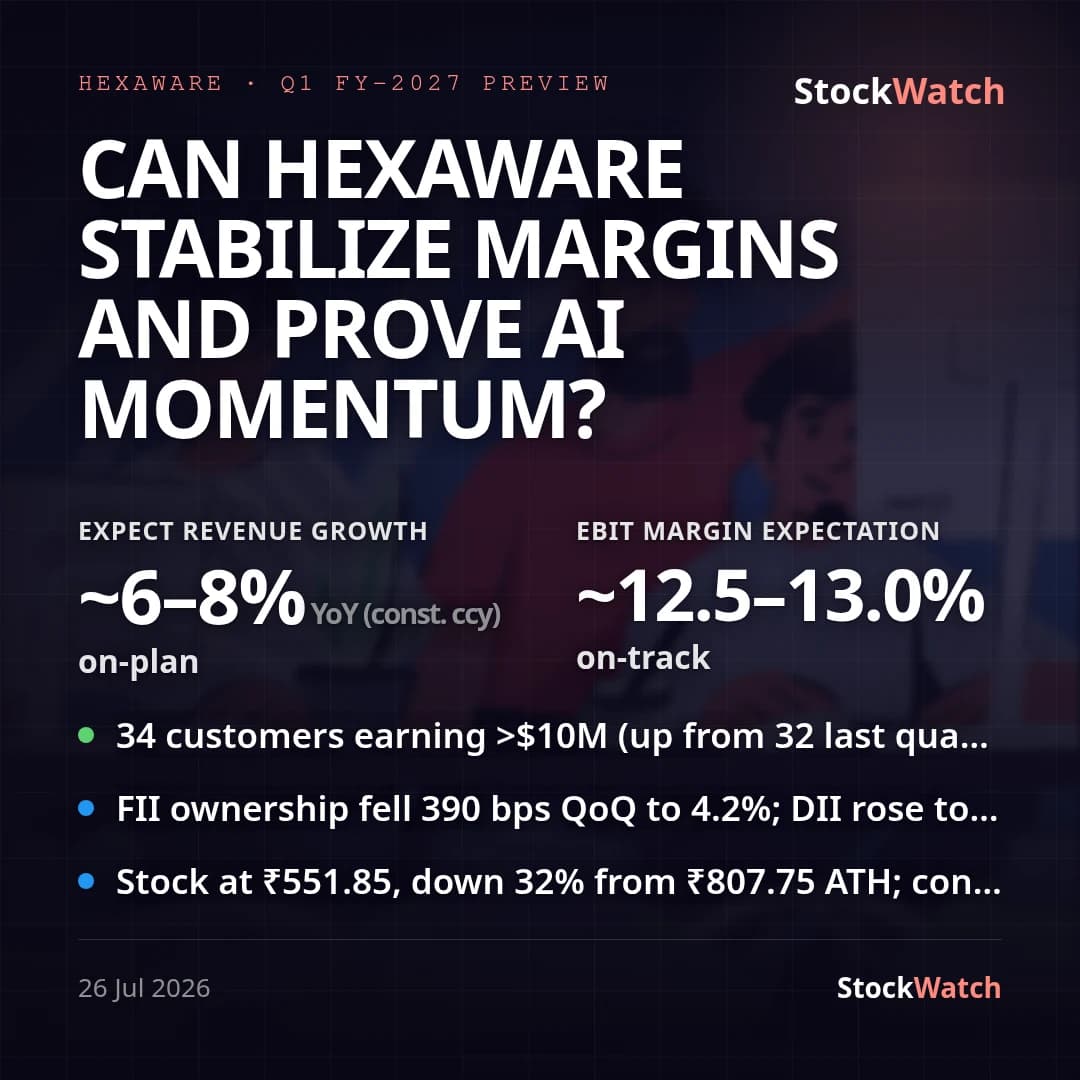
Hexaware's consolidated (primary basis) Q1 FY-2027 (Apr-Jun 2026) print shows revenue of ₹3,845.2 Cr, up 17.9% YoY and 6.4% QoQ, but PAT of ₹330.2 Cr down 13.0% YoY and 6.1% QoQ, with net margin compressing to 8.6% from 11.1% a year ago and 9.7% last quarter. Adjusting for one-offs on both sides — this quarter's ₹4.7 Cr CPS acquisition transaction cost versus a net ~₹27.2 Cr one-off gain embedded in the year-ago consolidated base (a ₹158.7 Cr contingent-consideration gain on an earlier acquisition, partly offset by a ₹78.2 Cr customer-dispute charge, ₹43.5 Cr severance costs, ₹22.7 Cr ERP-transformation costs and ₹39.4 Cr customer-relationship impairment) — underlying consolidated PAT growth is closer to -17%, worse than the reported -13%, because last year's base was itself inflated by a one-off gain that has now rolled off. The margin drag sits mainly on the employee-cost and other-income lines: employee benefits expense rose to ₹2,266.4 Cr (58.9% of income) from ₹1,907.8 Cr a year ago, while other income swung to a net loss of ₹50.1 Cr, driven by a ₹78.3 Cr forex loss this quarter versus a ₹13.7 Cr loss a year ago. This is broadly consistent with management's own prior guidance of a weak H1 on deal-ramp and rebadging costs ahead of an H2 margin recovery toward the guided 13-14% full-year EBIT band — this quarter's consolidated EBIT-equivalent margin (profit before exceptional items and tax over total income) works out to about 11.6%, below that full-year range but in line with the flagged weak-H1 framing. A striking divergence: standalone (parent-only) PAT actually grew 18.1% YoY to ₹200.0 Cr on revenue growth of 15.0%, the opposite direction of the consolidated decline — the gap traces to the one-off contingent-consideration gain and associated impairment/charges that were booked at the Group (subsidiary) level last year, not at the standalone entity, so the consolidated YoY comparison carries a much harder prior-year base than the standalone one. Reported revenue growth (+17.9% YoY consolidated) also runs well ahead of the pre-result read of "flat constant-currency growth," implying the headline is significantly boosted by recent inorganic additions (CPS, Mobiquity, SMC Squared and other subsidiaries) rather than organic expansion — a distinction the street will likely probe. No consensus PAT/revenue estimate for this specific quarter could be confirmed via web search, so vsStreet is marked unknown; the only available read is the bullish pre-result analyst consensus (Buy, 15 analysts, 12-month target ₹870-888) built on the AI-deal-acceleration and margin-recovery thesis. Corporate developments this quarter — the May 28, 2026 acquisition of UK-based Consulting Professionals Services (CPS) for GBP 6 million upfront plus up to GBP 5 million contingent consideration, the dismissal of Natsoft/Updraft's USD 500 million patent-infringement suit by a US federal court, and new hyperscaler-partnership and Chief Platform Officer leadership appointments — support the AI/hyperscaler and large-deal narrative but did not materially move this quarter's P&L beyond the ₹4.7 Cr CPS transaction cost. Going into Q2, the key markers are whether the guided H2 margin recovery toward 13-14% materialises, how CPS integration costs flow through, and whether reported revenue growth converges toward or continues to outpace the flagged flat constant-currency organic trend.

29 Jul 2026, 09:10 pm