StockWatch
·

MANGALAM CEMENT LTD.

BSE: 502157

P/L Snapshot

Q2 FY27 · standalone

vs Q1 FY27·vs Q2 FY26
Revenue
442.85
-4.9%+9.4%
Expenditure
432.75
-2.1%+11.5%
Net Profit
7.41
-59.0%-63.2%
OPM %
9.36%
-2.37pp-1.45pp

Shareholding

Pattern breakdown

P/L Trends

(in crores)

RevenueExpenditureNet Profit
0.00144.54289.07433.61578.14Q2 FY25Q3 FY25Q4 FY25Q1 FY26Q2 FY26Q3 FY26Q4 FY26Q1 FY27Q2 FY27
Price Chart
Reports

Mangalam Cement Q2 FY27: PAT sinks 63% YoY to ₹7.4 Cr on margin squeeze

cement · margin compression · cost inflation

ResultsQ2 FY2703 Nov 20263 minIndustrials & Infra

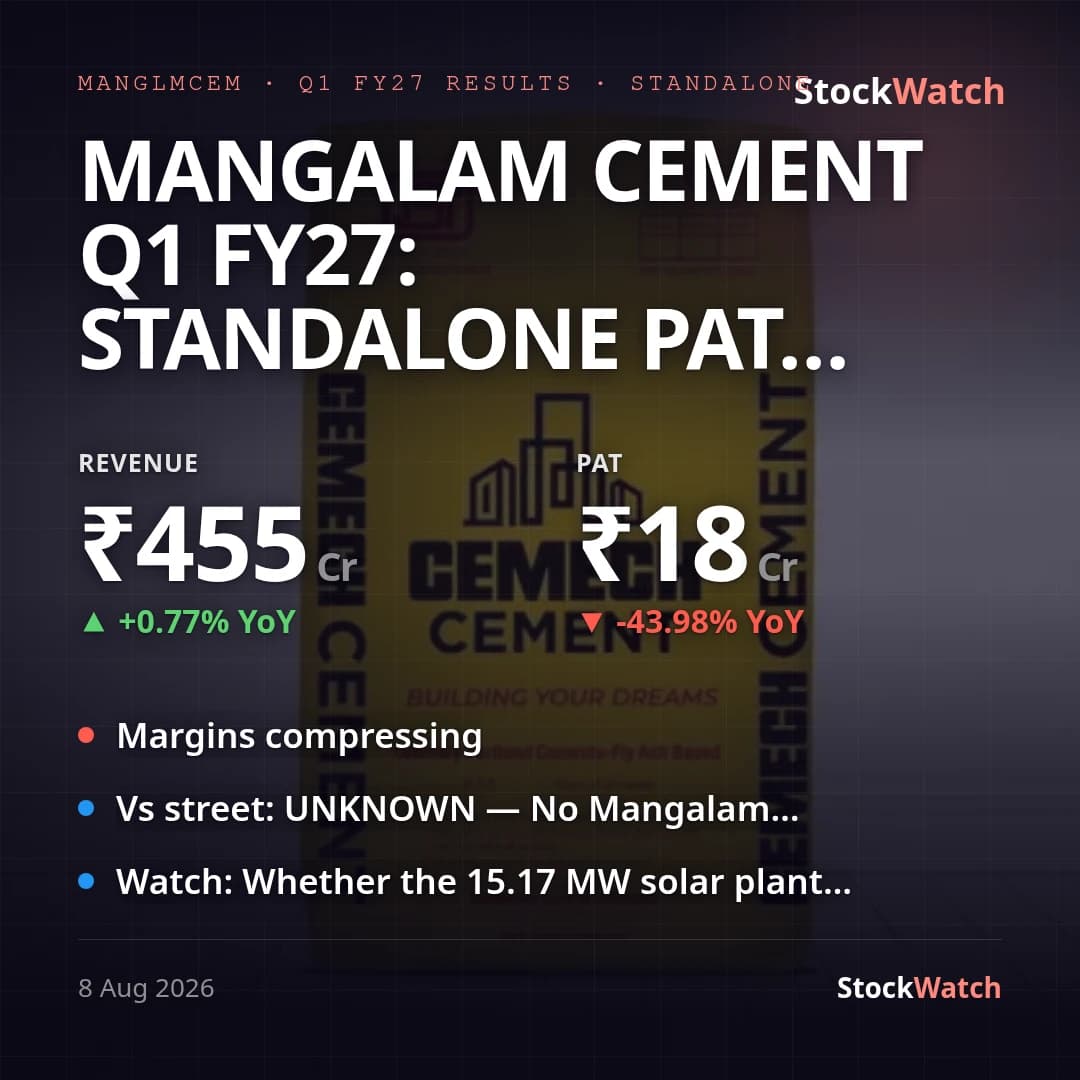
Mangalam Cement Q1 FY27: standalone PAT slumps 44% YoY as margins compress on flat revenue

cement · margin compression · inventory swing

ResultsQ1 FY2708 Aug 20263 minIndustrials & Infra
Latest
Quarterly Result3 Nov, 3:20 pm

Mangalam Cement Q2 FY27: PAT sinks 63% YoY to ₹7.4 Cr on margin squeeze

Mangalam Cement's standalone (only basis reported — no consolidated statement filed) PAT for Q2 FY27 fell 63.2% YoY to ₹7.41 Cr from ₹20.11 Cr a year ago, even as revenue from operations grew 9.7% YoY to ₹433.36 Cr. Revenue growth did not translate into earnings — the decline extends the margin compression already seen in Q1 FY27 (standalone PAT -44% YoY per our records) and is now steeper: net profit margin fell to 1.67% from 4.97% a year ago and 3.88% last quarter, while operating margin slipped to 9.36% from 10.81% YoY. Sequentially PAT is down 59% from ₹18.07 Cr in Q1 FY27 on a 4.8% QoQ revenue decline. The margin squeeze sits mainly on raw-material and inventory lines, not pricing. Cost of materials consumed rose 35.3% YoY to ₹106.34 Cr, and the company swung from a large non-cash inventory build-up a year ago (a ₹38.75 Cr credit that reduced reported expenses as finished-goods stock rose) to a small ₹2.19 Cr net destocking charge this quarter — a ₹40.9 Cr unfavorable swing that was the single largest driver behind total expenses rising ₹44.6 Cr YoY, larger even than the rise in raw material costs itself. Freight and forwarding added further pressure, up 15% YoY to ₹103.23 Cr, and finance costs rose 11.6% to ₹17.61 Cr as current borrowings climbed to ₹704.05 Cr from ₹594.32 Cr at FY26-end. Partially offsetting this, power and fuel costs fell 21.9% YoY to ₹101.74 Cr — plausibly aided by the 15.17 MW solar plant that began supplying power on 6th August 2026, though the filing gives no cost attribution to confirm this. No reliable, named-brokerage consensus estimate could be confirmed for this quarter — a generic analyst-estimate aggregator showed EPS near ₹6.3 against the actual ₹2.70, directionally a miss, but the source is too thin on provenance to cite as firm street consensus for this smallcap. Management has no formal guidance or outlook on record, and no press release accompanying this filing was available to cross-check management's own framing — the board's cover letter is procedural only, with no commentary on the quarter's drivers. This quarter's other company developments were largely non-financial and outside the P&L: a ₹2.7 Cr GST tax demand for wrongly availed ITC (8th October 2026) is immaterial to this result, and management denied holding undisclosed material information behind an August stock volume surge. Half-year standalone PAT is down 51.3% YoY to ₹25.48 Cr on revenue up 5.0% to ₹888.57 Cr, confirming the margin pressure is a trend across H1 FY27 rather than a one-quarter event. Going into H2 FY27, cost inflation — materials, freight and finance costs — is outrunning the topline recovery, and margins have not found a floor across two consecutive quarters of standalone PAT decline.

3 Nov 2026, 03:20 pm

Board Meeting8 Aug, 4:20 pm

Mangalam Cement Q1 FY27: standalone PAT slumps 44% YoY as margins compress on flat revenue

Mangalam Cement's standalone Q1 FY27 (quarter ended June 30, 2026) revenue was ₹455.22 Cr, up just 0.77% YoY and down 7.18% QoQ. Net profit fell sharply to ₹18.07 Cr, down 43.98% YoY and 72.30% QoQ, with EPS at ₹6.57 versus ₹11.73 a year ago and ₹23.72 in Q4 FY26. Net profit margin contracted to 3.88% from 6.98% a year earlier (and versus 12.88% in Q4 FY26) — this is a profitability story, not a topline one, since revenue held roughly flat. Total expenses rose 7.0% YoY to ₹442.18 Cr against near-flat revenue. The single biggest driver was the Change in Inventories of Finished Goods and Work-in-Progress line, which swung from -₹20.20 Cr in Q1 FY26 (an inventory build that reduced reported costs) to +₹34.57 Cr in Q1 FY27 (an inventory drawdown that added to costs) — an adverse swing of roughly ₹54.8 Cr. Finance costs rose 10.7% YoY to ₹18.27 Cr and depreciation rose 9.5% YoY to ₹22.07 Cr. Notably, cost of materials consumed fell 21.4% YoY and power & fuel fell 5.6% YoY, so the margin squeeze was largely a working-capital/inventory and finance-cost effect rather than input-cost inflation on materials or fuel. The steeper QoQ profit decline needs a caveat: Q4 FY26's ₹65.23 Cr reported PAT was flattered by a one-off ₹58.40 Cr deferred-tax credit, even though that quarter's PBT (after a ₹20.73 Cr exceptional charge) was only ₹13.04 Cr — so the QoQ comparison overstates the sequential deterioration. Management gives no formal guidance on record, and no analyst consensus or street estimate specific to Mangalam Cement could be located for this quarter — small-cap cement names outside the JK Cement/JSW Cement/UltraTech tier get little dedicated coverage — so vsStreet is unknown. Sector-wide, brokerage previews flagged healthy Q1 FY27 cement volume growth (roughly 5-8% YoY) alongside margin pressure from rising petcoke costs; Mangalam's own revenue growth of under 1% YoY lagged that sector volume narrative even as it avoided the worst of the fuel-cost spike, since power & fuel costs actually declined YoY. With zero exceptional items this quarter, Q1 FY27 offers a cleaner base after two consecutive quarters (Q4 FY26 and FY26 full year) carrying Petcoke-advance-provision and labour-code exceptional charges. The concrete forward lever is the 15.17 MW captive solar plant, which commenced power supply on August 6, 2026 — just after quarter-end — against power & fuel costs that still ran at ₹103.71 Cr (about 22.8% of revenue) in Q1 FY27.

8 Aug 2026, 04:20 pm

Corporate Events

Board MeetingMANGLMCEM
2026
3Nov

Board Meeting

The meeting of the Board of Directors will be held to consid…

BSE Filing ↗
Board MeetingMANGLMCEM
2026
21Aug

Board Meeting

The 50th AGM of the Company is scheduled to be held on Frida…

BSE Filing ↗
DividendMANGLMCEM
2026
14Aug

₹1.5 / share

BSE Filing ↗
Board MeetingMANGLMCEM
2026
8Aug

Board Meeting

The Board of Directors will consider and approve the Un-audi…

BSE Filing ↗
Board MeetingMANGLMCEM
2026
16May

Board Meeting

The Board of Directors meeting was held on May 16, 2026. Th…

BSE Filing ↗
Board MeetingMANGLMCEM
2026
6Feb

Board Meeting

Consider and approve the Un-audited Standalone Financial Res…

BSE Filing ↗
Board MeetingMANGLMCEM
2025
8Nov

Board Meeting

Board Meeting intimation, Consider and approve Un-audited St…

BSE Filing ↗
DividendMANGLMCEM
2025
15Aug

₹1.5 / share

BSE Filing ↗
Board MeetingMANGLMCEM
2025
8Aug

Board Meeting

Consider and approve Un-audited Financial Results

BSE Filing ↗
Board MeetingMANGLMCEM
2025
10May

Board Meeting

Consider and approve the audited Standalone Financial Result…

BSE Filing ↗
Board MeetingMANGLMCEM
2025
6Feb

Board Meeting

consider and approve The Unaudited Financial Results

BSE Filing ↗
Board MeetingMANGLMCEM
2024
14Nov

Board Meeting

Consider and approve the Unaudited Standalone Financial Resu…

BSE Filing ↗
DividendMANGLMCEM
2024
19Jul

₹1.5 / share

BSE Filing ↗
Board MeetingMANGLMCEM
2024
27Jan

Board Meeting

To consider and approve the Unaudited Standalone Financial R…

BSE Filing ↗
Board MeetingMANGLMCEM
2023
8Aug

Board Meeting

To consider and approve un-audited standalone financial resu…

BSE Filing ↗