StockWatch
·

PNB GILTS LTD.

BSE: 532366

P/L Snapshot

Q1 FY27 · standalone

vs Q4 FY26·vs Q1 FY26
Revenue
454.72
+7.2%-19.3%
Expenditure
346.53
-15.5%-1.1%
Net Profit
80.70
+521.2%-49.6%
OPM %
96.67%
+18.64pp+1.19pp

Shareholding

Pattern breakdown

P/L Trends

(in crores)

RevenueExpenditureNet Profit
-118.4070.30259.01447.71636.42Q3 FY18Q4 FY18Q1 FY19Q2 FY19Q3 FY19Q4 FY25Q1 FY26Q2 FY26Q4 FY26Q1 FY27
Price Chart
Reports

PNB Gilts Q1 PAT ₹80.7 Cr, down ~50% YoY as bond trading gains fade; sharp QoQ rebound

ResultsQ1 FY2716 Jul 20263 minFinancial Services
Latest
Quarterly Result16 Jul, 8:40 pm

PNB Gilts Q1 PAT ₹80.7 Cr, down ~50% YoY as bond trading gains fade; sharp QoQ rebound

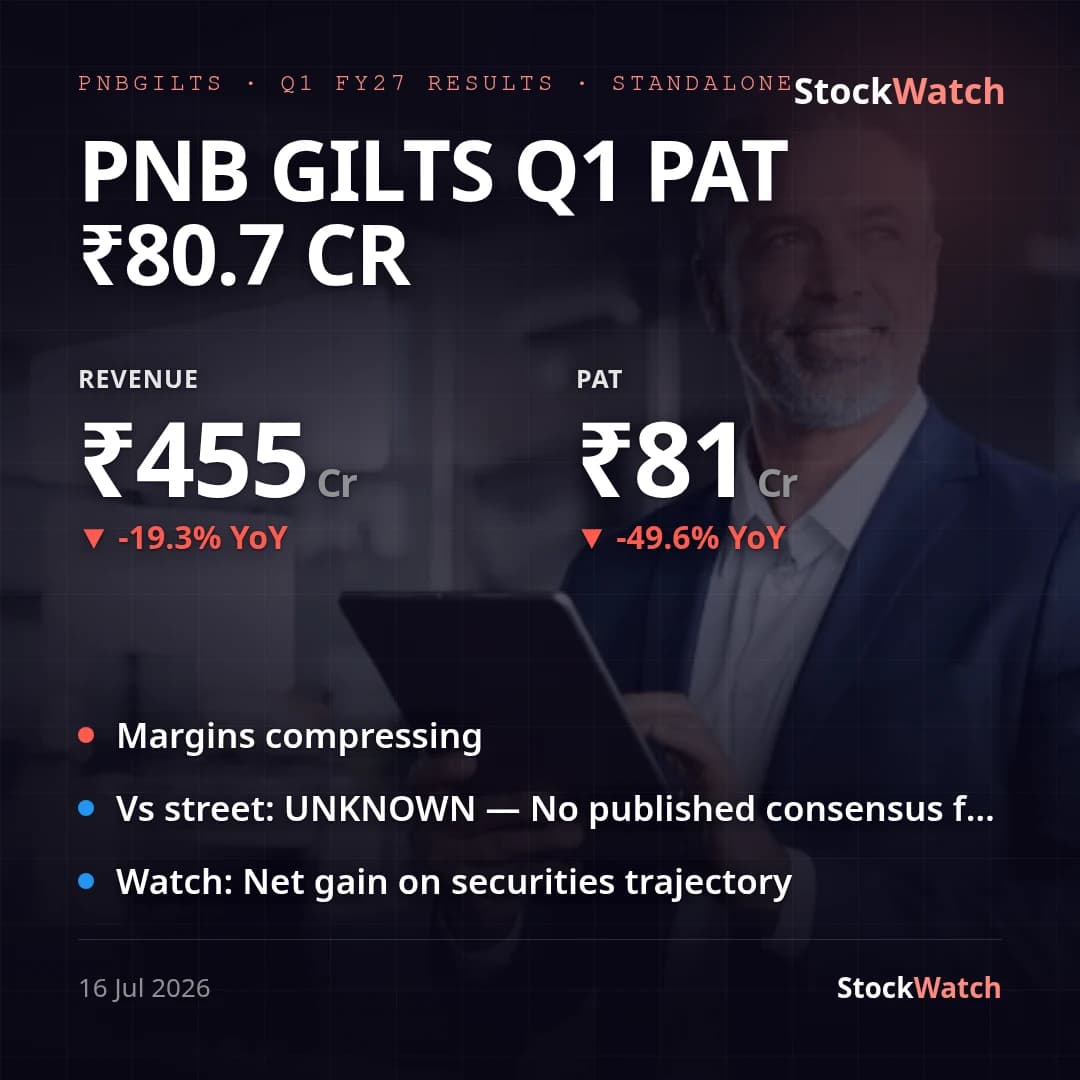
PNB Gilts reported standalone Q1 FY27 (quarter ended 30 Jun 2026) net profit of ₹80.7 Cr on total income of ₹454.7 Cr, a year-on-year decline of ~49.6% in profit and ~19.3% in revenue against a strong year-ago base. The verdict is weak on a YoY basis, and the driver is almost entirely trading: net gain on securities collapsed to ₹18.2 Cr from ₹156.7 Cr in Q1 FY26, when a bond rally handed the primary dealer an outsized mark-to-market/realised gain. Net interest margin compressed to 17.8% from 28.4% a year ago purely because of this lower trading contribution — the core carry actually improved. Stripping the trading line out, the underlying book is steadier than the headline suggests. Interest income rose to ₹433.5 Cr (from ₹403.9 Cr) while finance costs were broadly flat at ₹330.8 Cr, lifting net interest income to ~₹102.7 Cr from ~₹79.5 Cr a year ago. So the funding spread widened YoY; the entire profit shortfall is the normalisation of securities gains from an exceptional FY26 level. Employee and other operating costs also fell sharply, keeping total expenses at ₹346.5 Cr. Sequentially the print looks dramatic — PAT up ~5.2x from ₹13.0 Cr in Q4 FY26 — but that is a rebound off a depressed base: Q4 FY26 absorbed a ₹72.5 Cr net LOSS on securities. Q1's return to a modest trading gain, rather than any step-change, explains the jump; the QoQ figure is not the story. An exceptional-item recovery of ₹0.08 Cr (SREI) is immaterial and does not move adjusted growth (~-49.6%). Effective tax was ~25.5% (₹27.6 Cr). Management provides no formal earnings guidance and no analyst consensus is published for this small-cap PD, so there is no street benchmark to beat or miss; the FY26 ₹2/share final dividend was declared at the April board and is unrelated to this quarter. The read-through going into Q2 is that results will again hinge on the direction of G-sec yields, which govern the trading line.

16 Jul 2026, 08:40 pm

Corporate Events

DividendPNBGILTS
2026
21Sep

Dividend

BSE Filing
Board MeetingPNBGILTS
2026
7Aug

Board Meeting

The Board of Directors considered the appointment of Sh. Am…

BSE Filing
Board MeetingPNBGILTS
2026
16Jul

Board Meeting

The Board of Directors meeting is scheduled to consider and …

BSE Filing
Board MeetingPNBGILTS
2026
20Apr

Board Meeting

To consider and approve the audited financial results for th…

BSE Filing
Board MeetingPNBGILTS
2026
17Jan

Board Meeting

Consider and approve the unaudited financial results

BSE Filing
Board MeetingPNBGILTS
2024
24Oct

Board Meeting

Consideration and approval of Unaudited Financial Results

BSE Filing
Board MeetingPNBGILTS
2024
24Jul

Board Meeting

Consider and approve the unaudited financial results for the…

BSE Filing
Board MeetingPNBGILTS
2024
29Apr

Board Meeting

consider and approve the audited financial results of the Co…

BSE Filing
Board MeetingPNBGILTS
2024
24Jan

Board Meeting

Consider and approve Unaudited Financial Results for the Qua…

BSE Filing
Board MeetingPNBGILTS
2023
20Oct

Board Meeting

Consider and approve Unaudited Financial Results of the Comp…

BSE Filing