


Industrials & Infra · Q2 FY27 results
Sector in the results season
Industrials & Infra · Q2 FY27 results
final · 636 of 1,001 results
636
of 1,001 results
47%
very good + good, of 395 rated
+13.9%
median YoY, n=439
-0.4%
median, n=386
Numbers
Profit up at 264 of 439 (60.1%) · growing faster than 15%: 218 (49.7%) · Median excludes extremes: revenue 5, profit 12
Reports
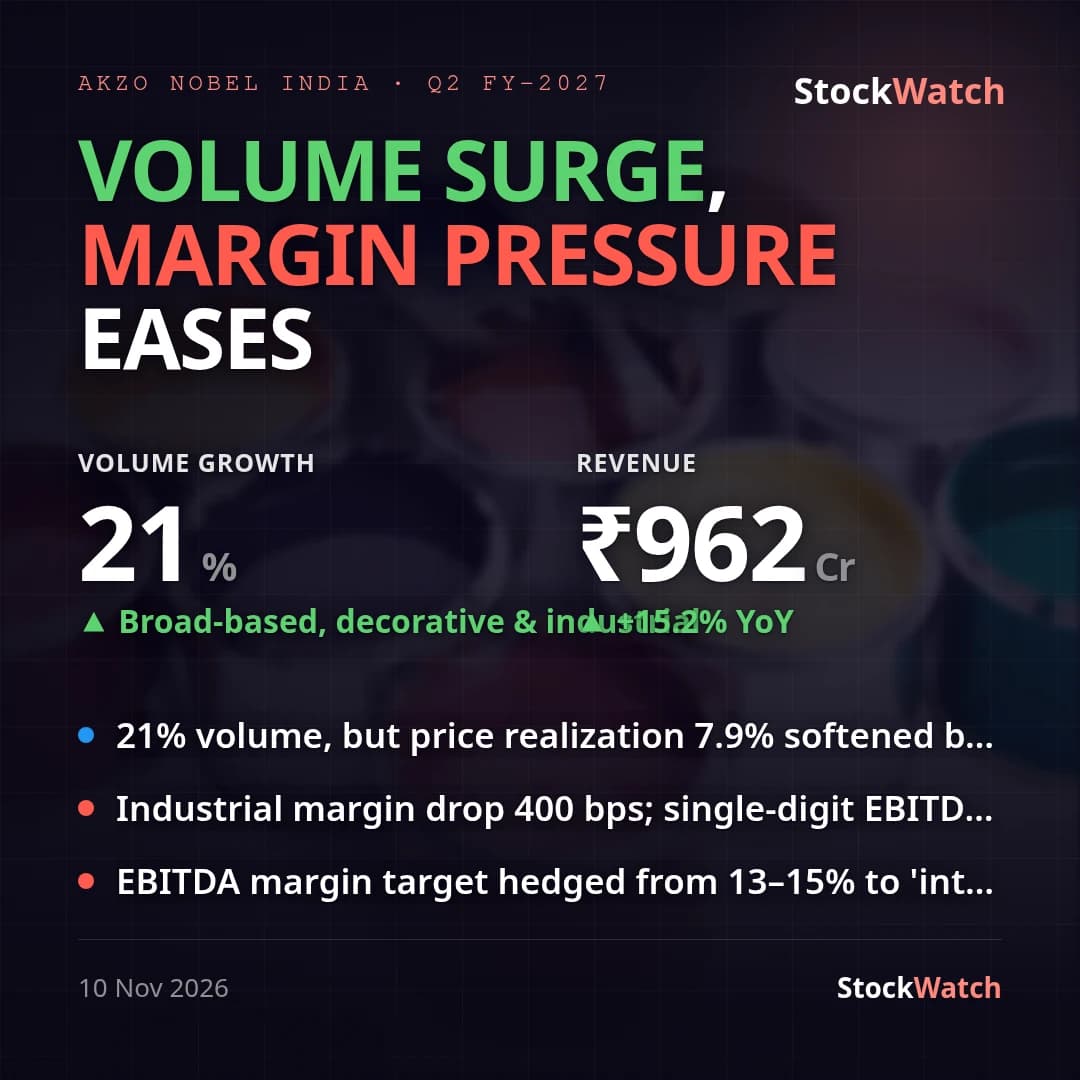 JSWDULUXResult verdict10 Nov
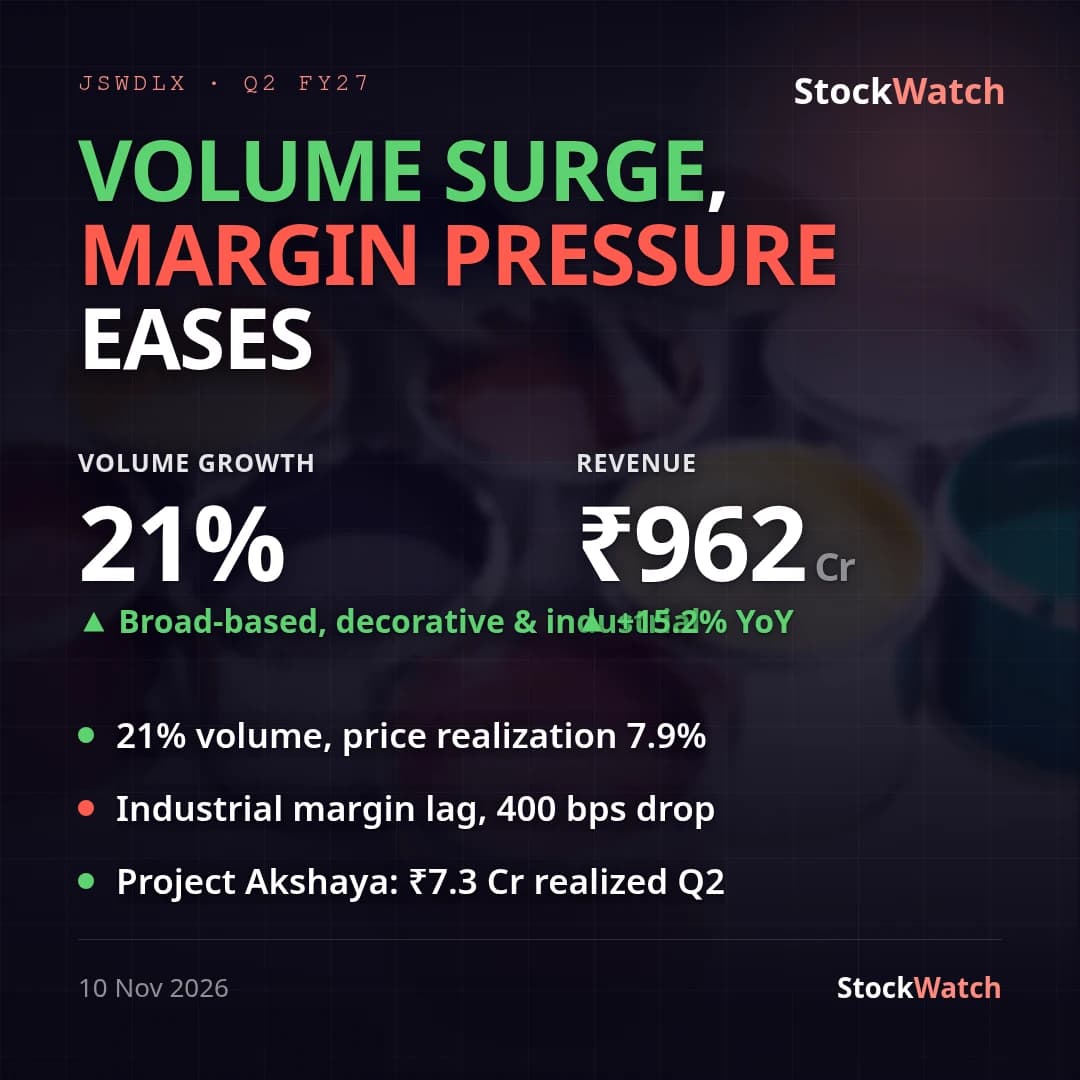 JSWDULUXTranscript10 Nov
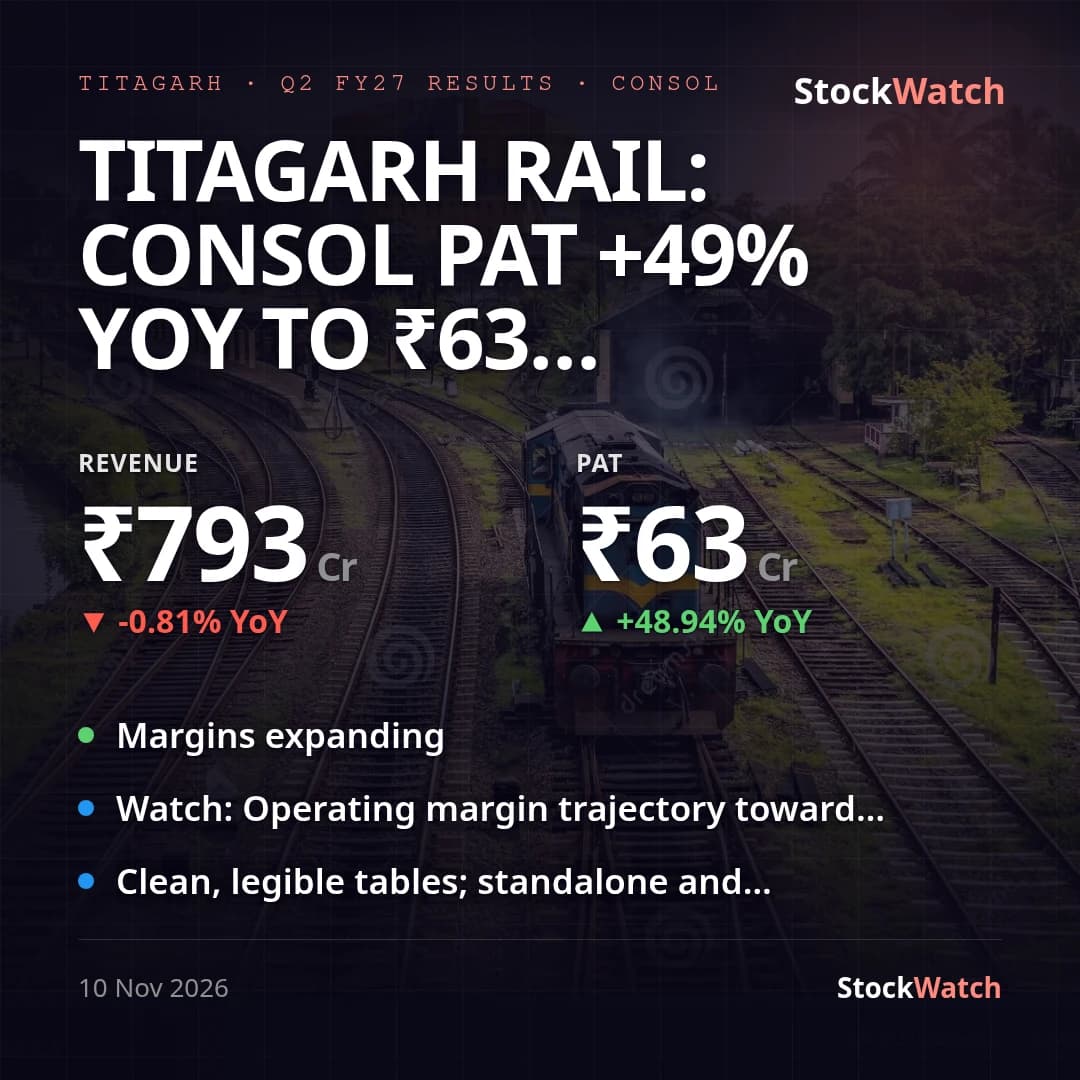 TITAGARHResults10 Nov
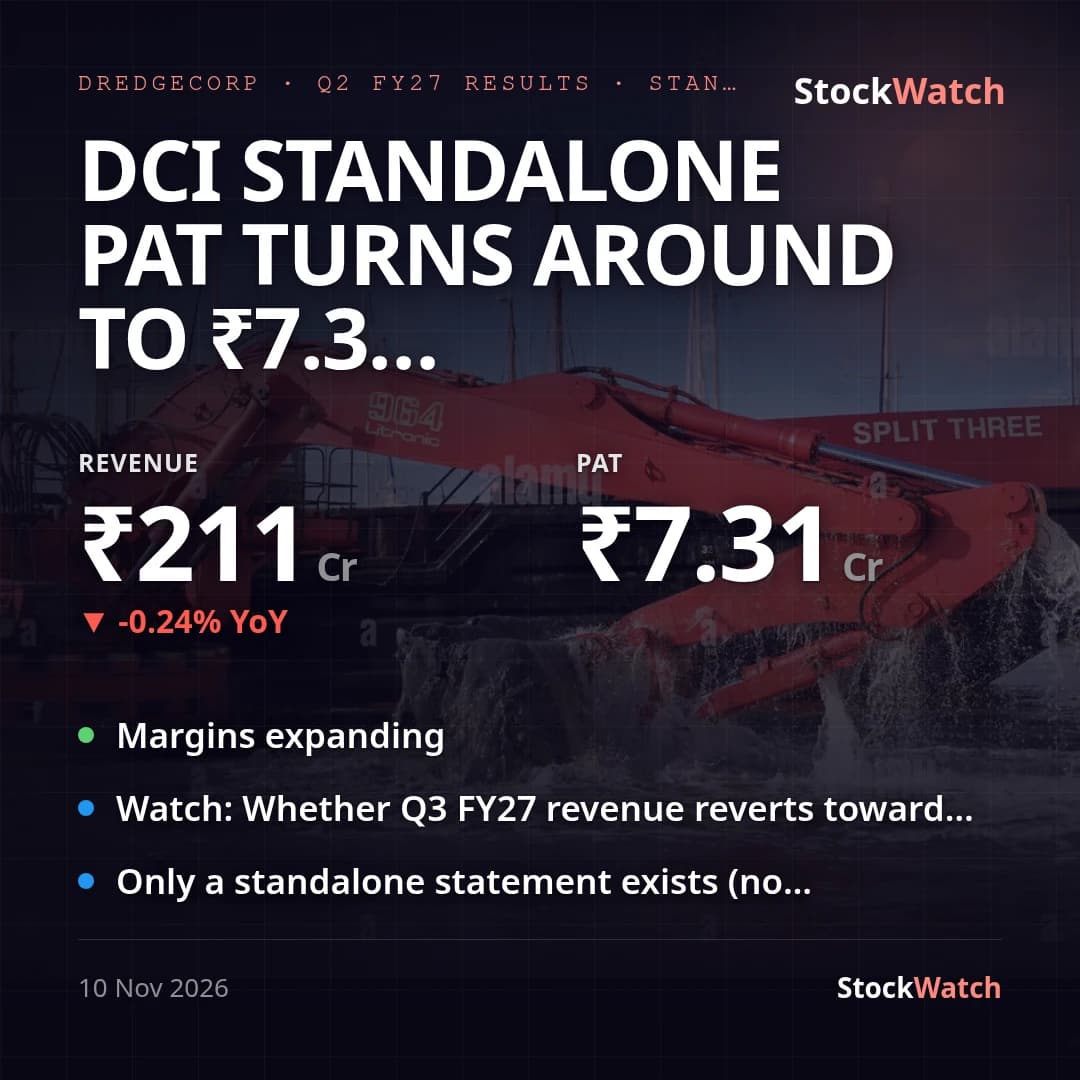 DREDGECORPResults10 Nov
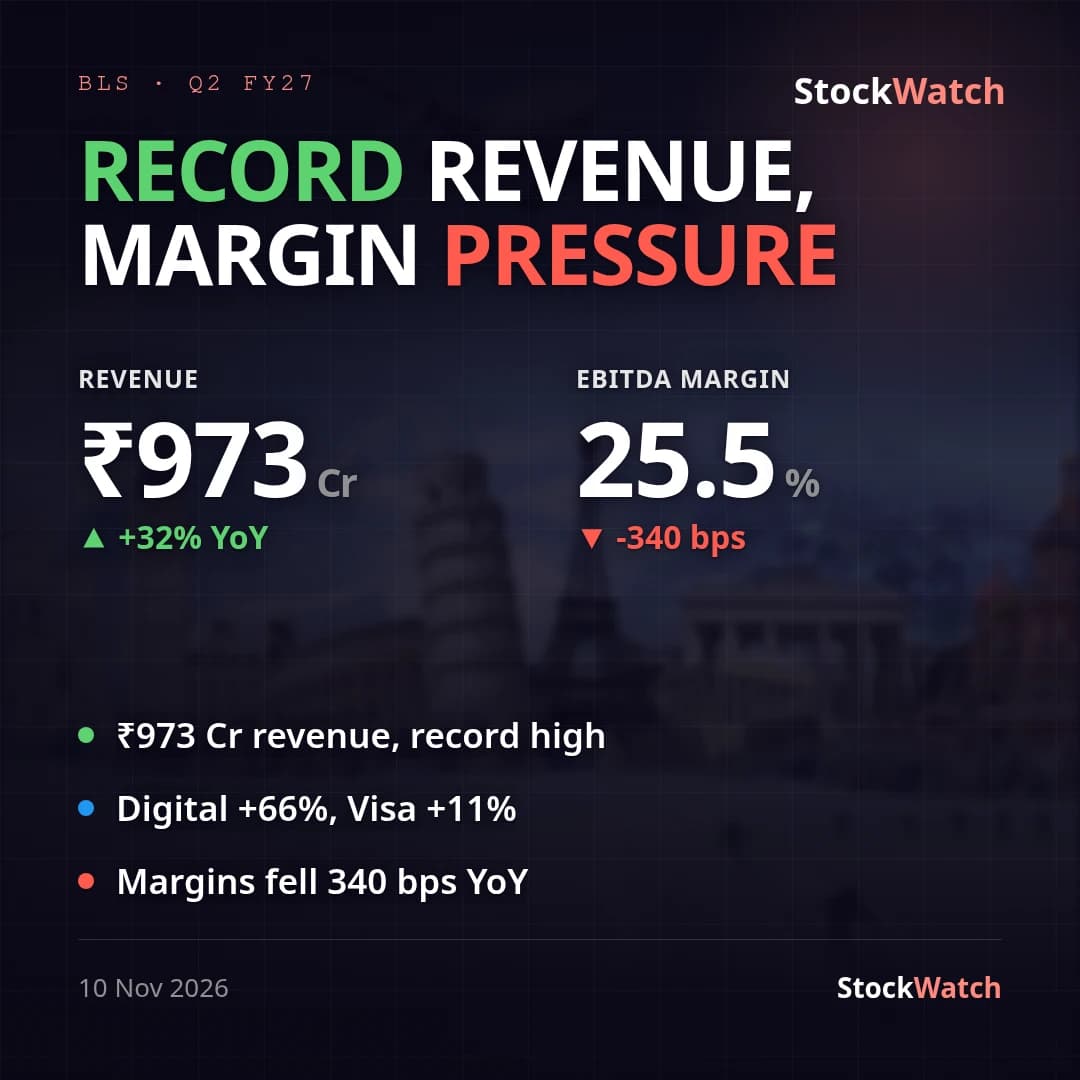 BLSResult verdict10 Nov
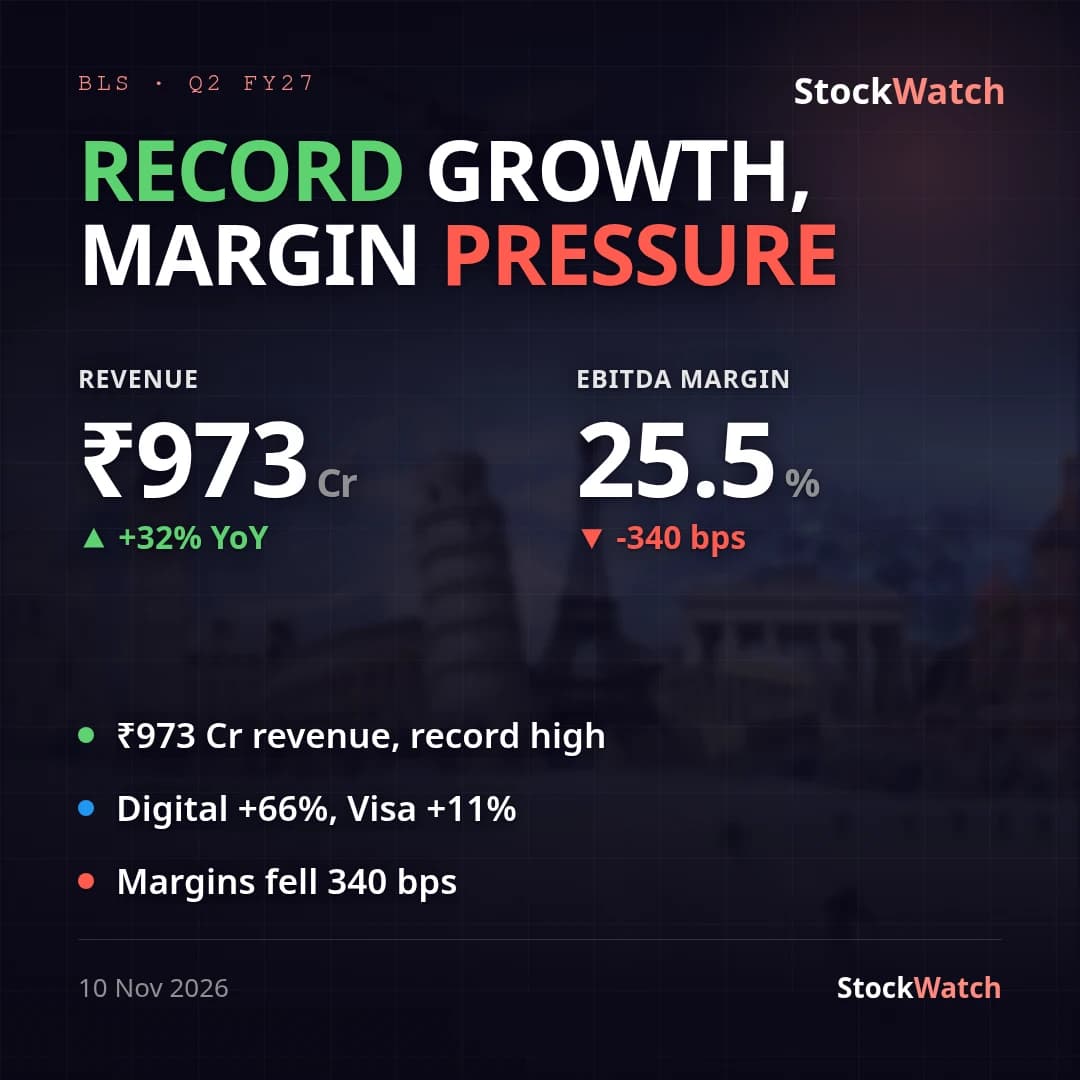 BLSTranscript10 Nov
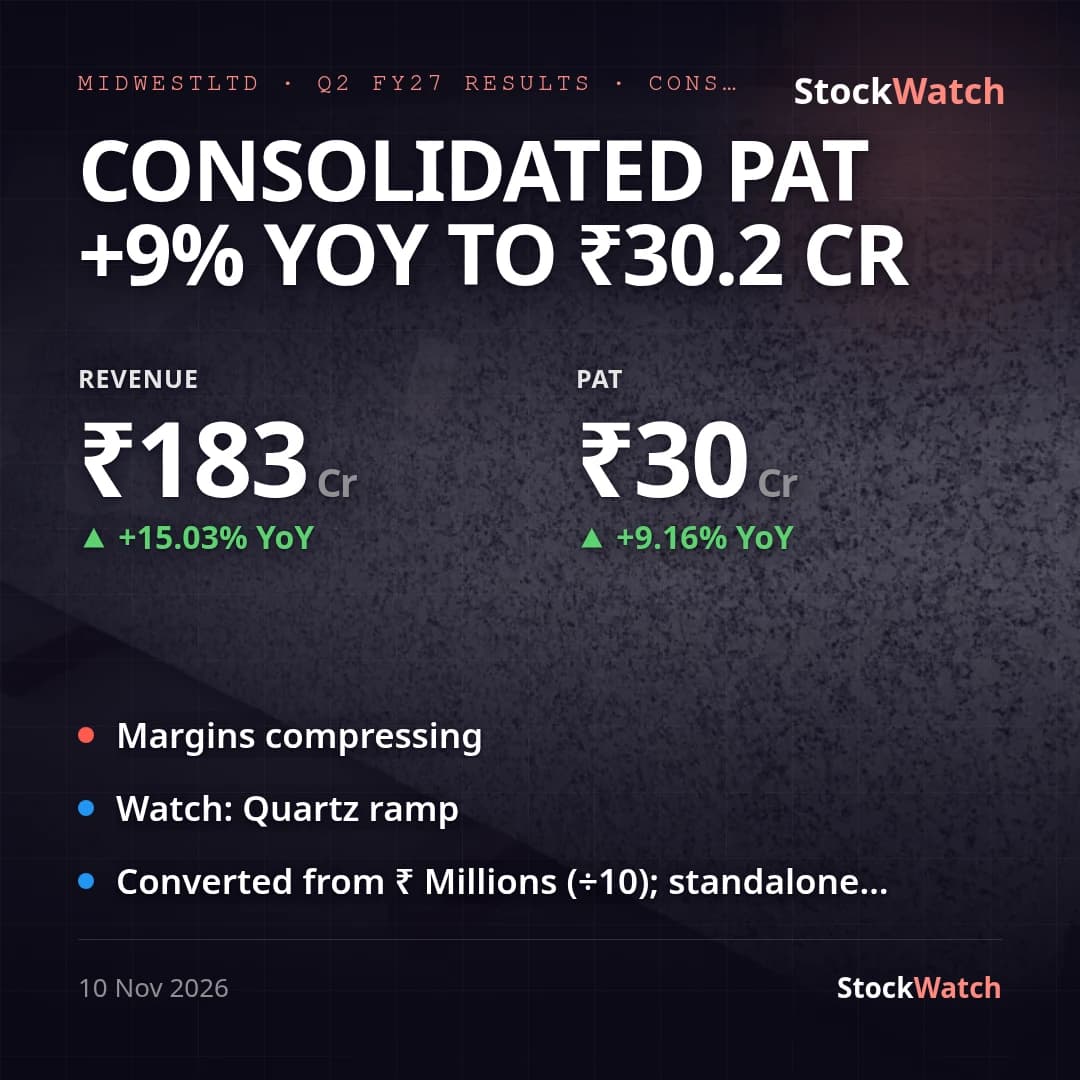 MIDWESTLTDResults10 Nov
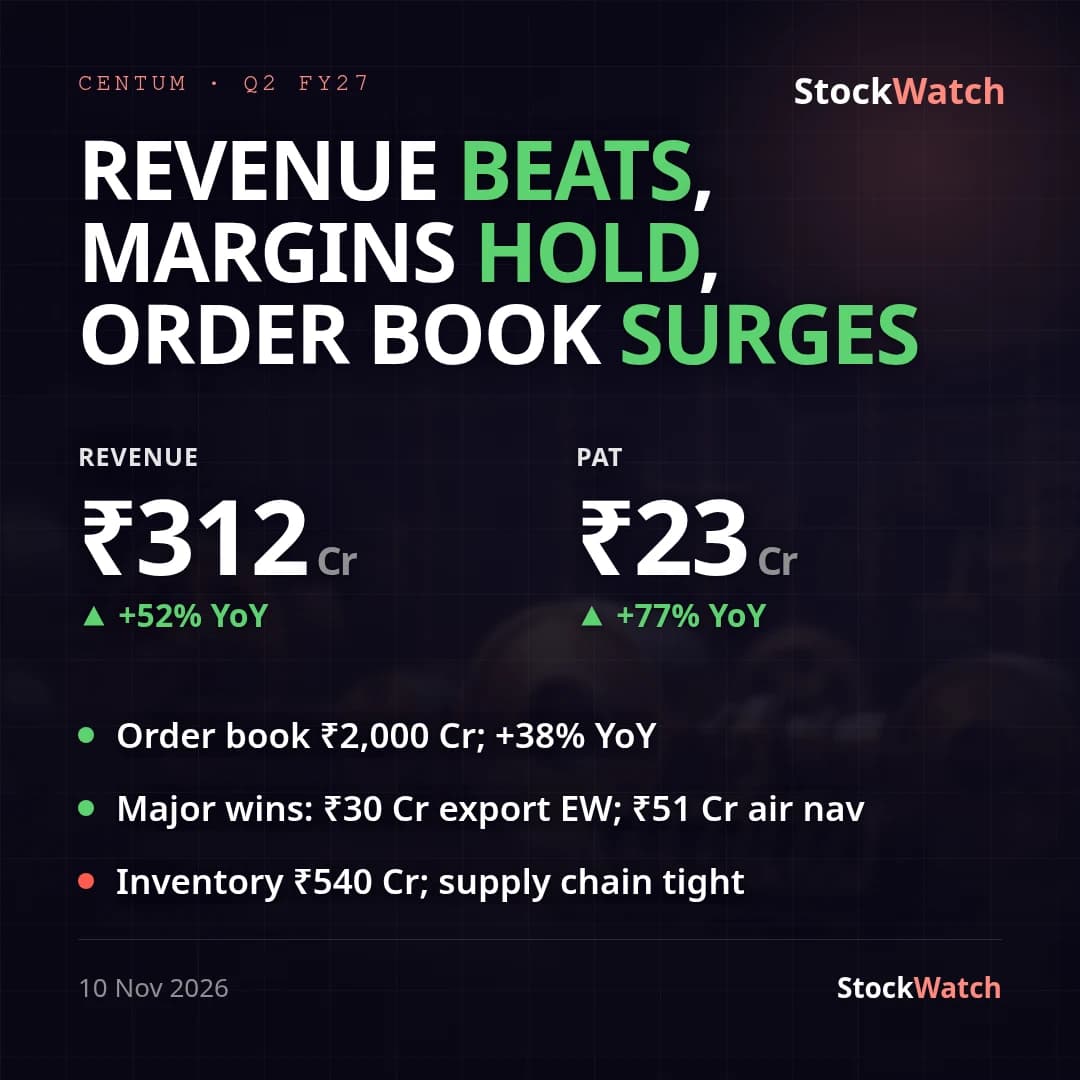 CENTUMTranscript10 Nov
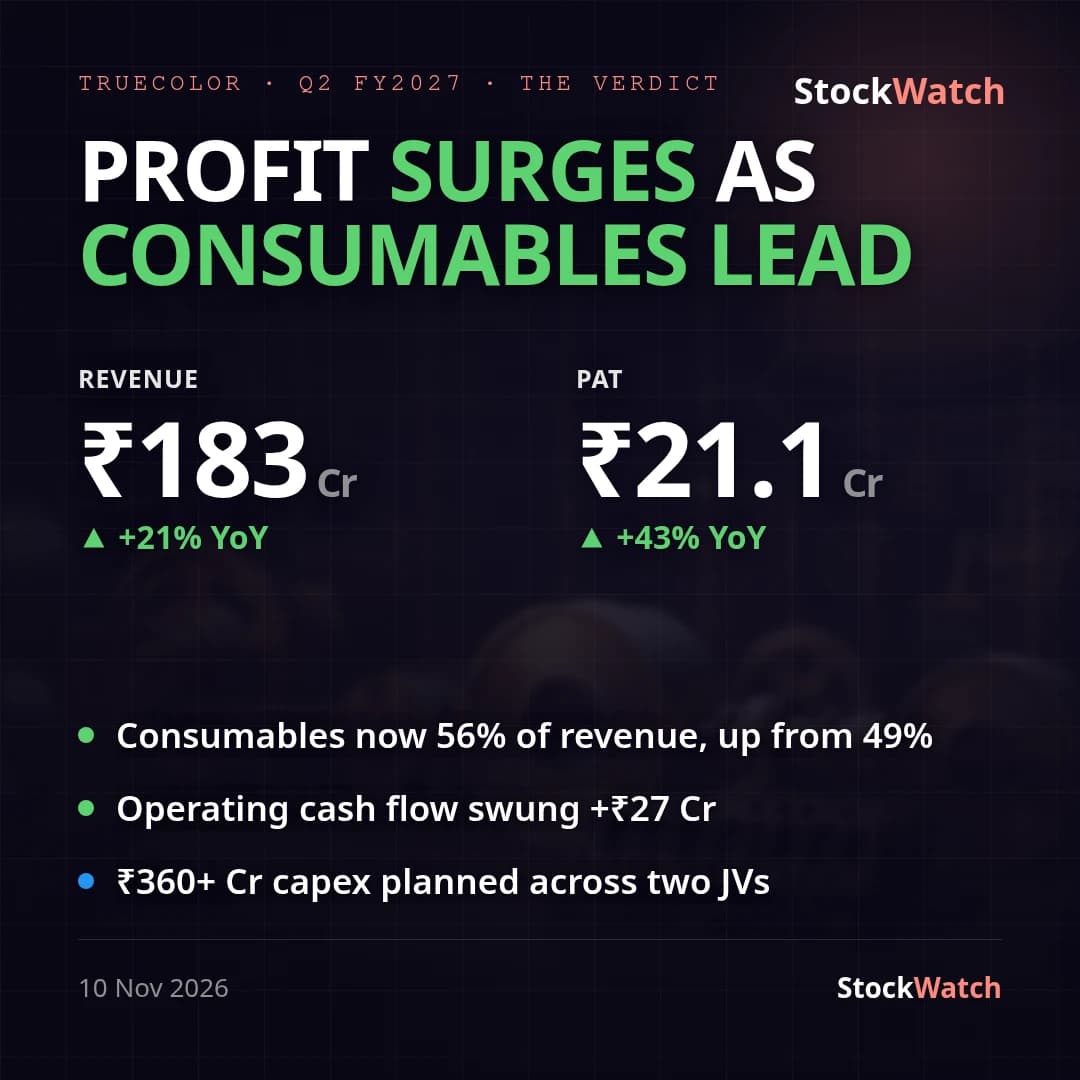 TRUECOLORSResult verdict10 Nov
 TRUECOLORSTranscript10 Nov
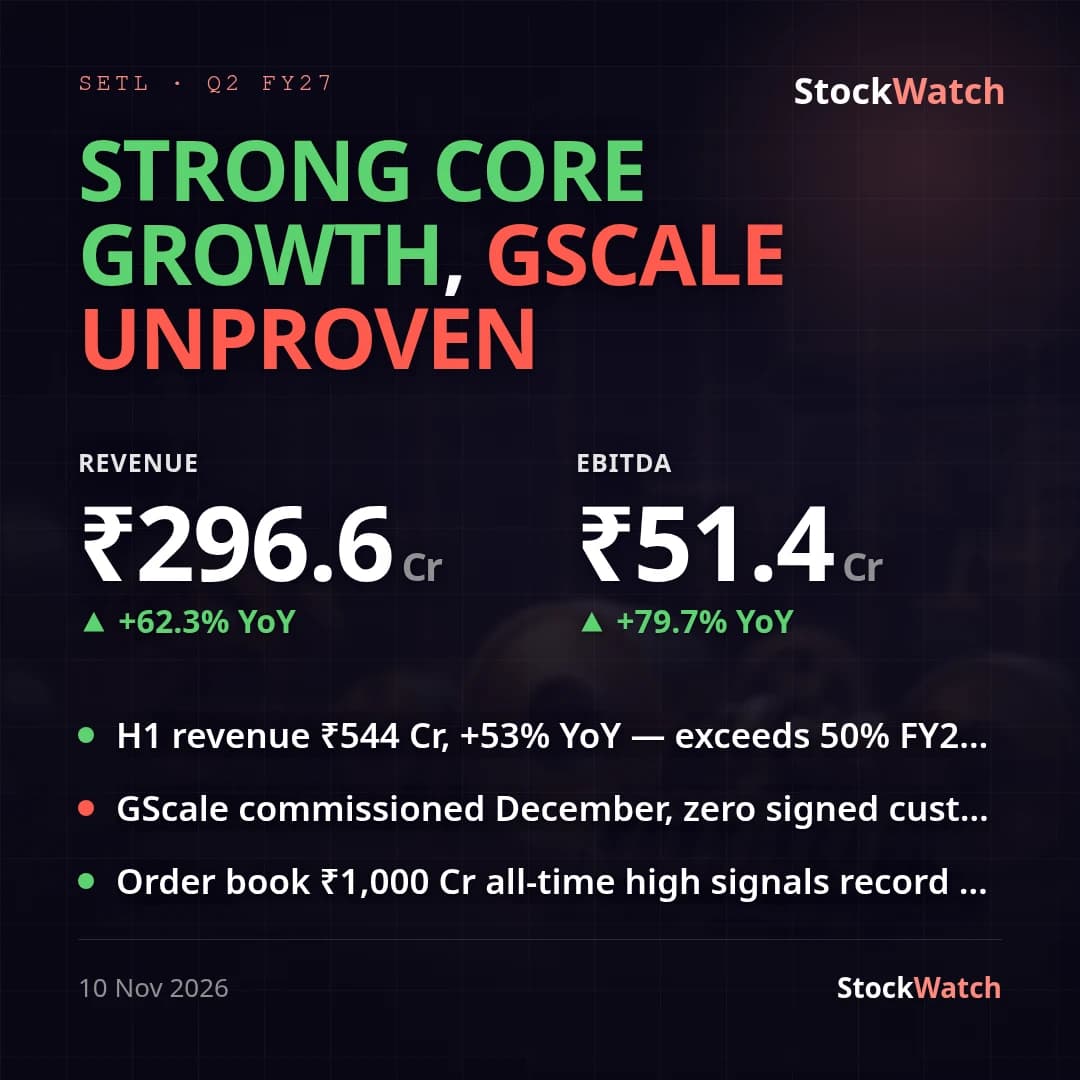 SETLResult verdict10 Nov
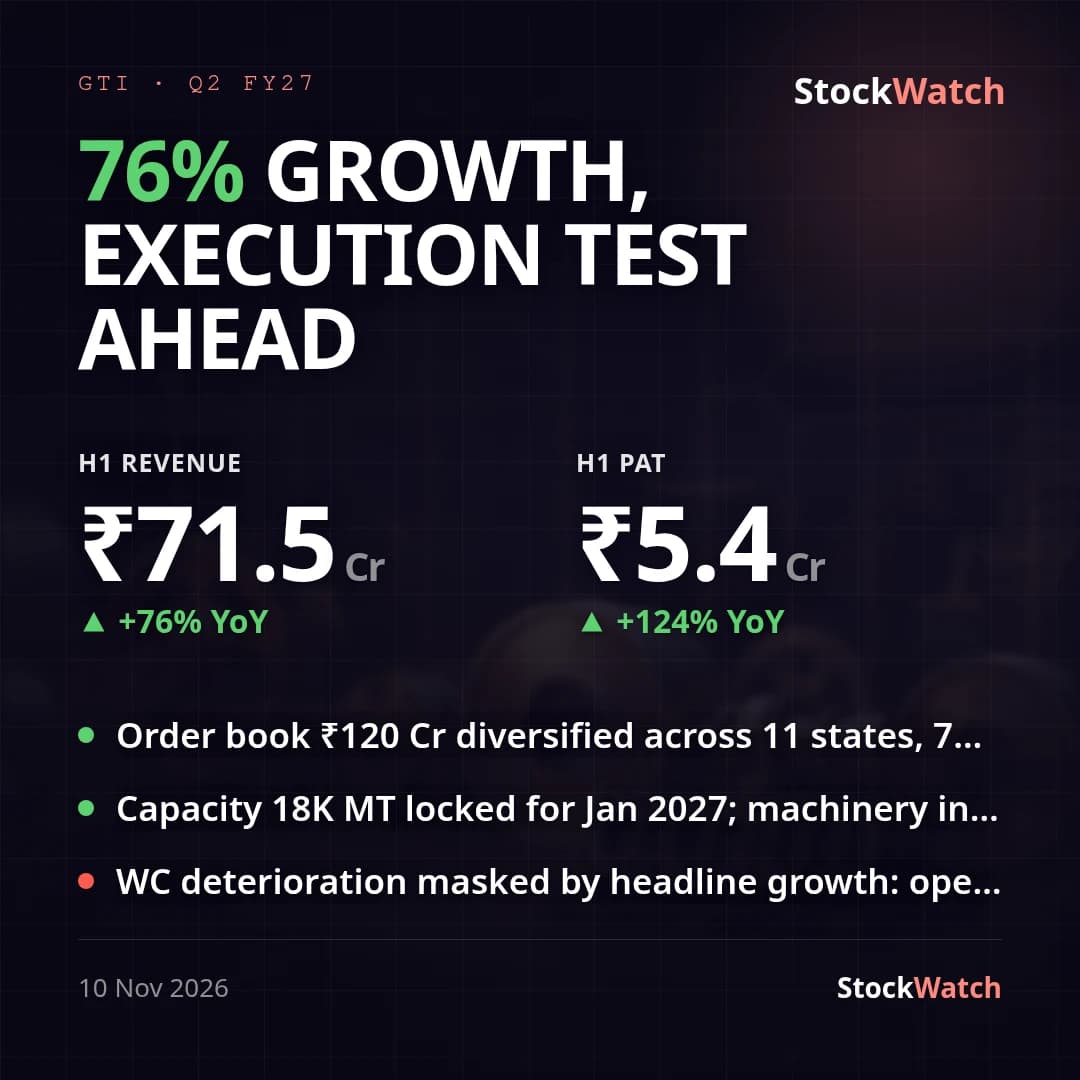 GTILResult verdict10 Nov
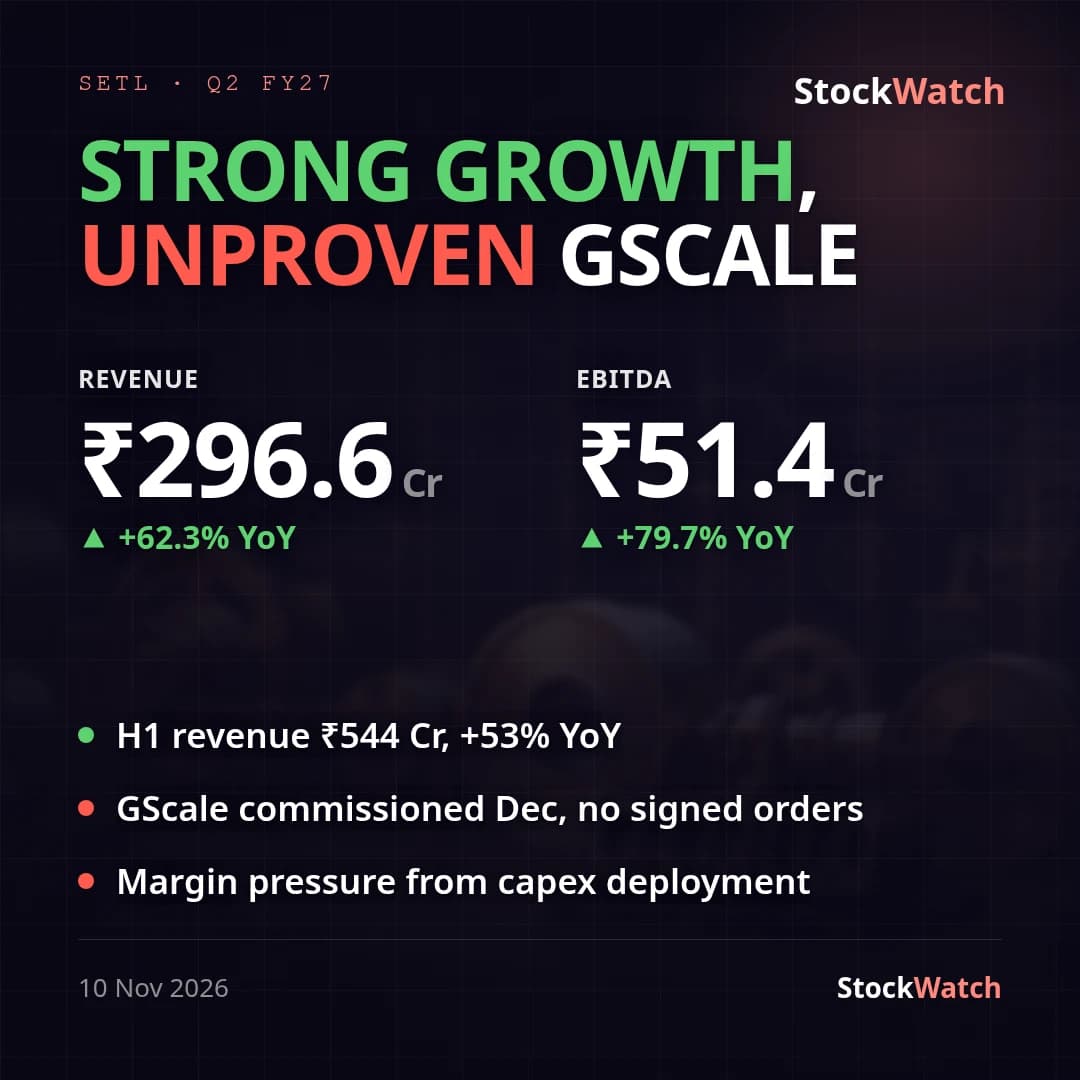 SETLTranscript10 Nov
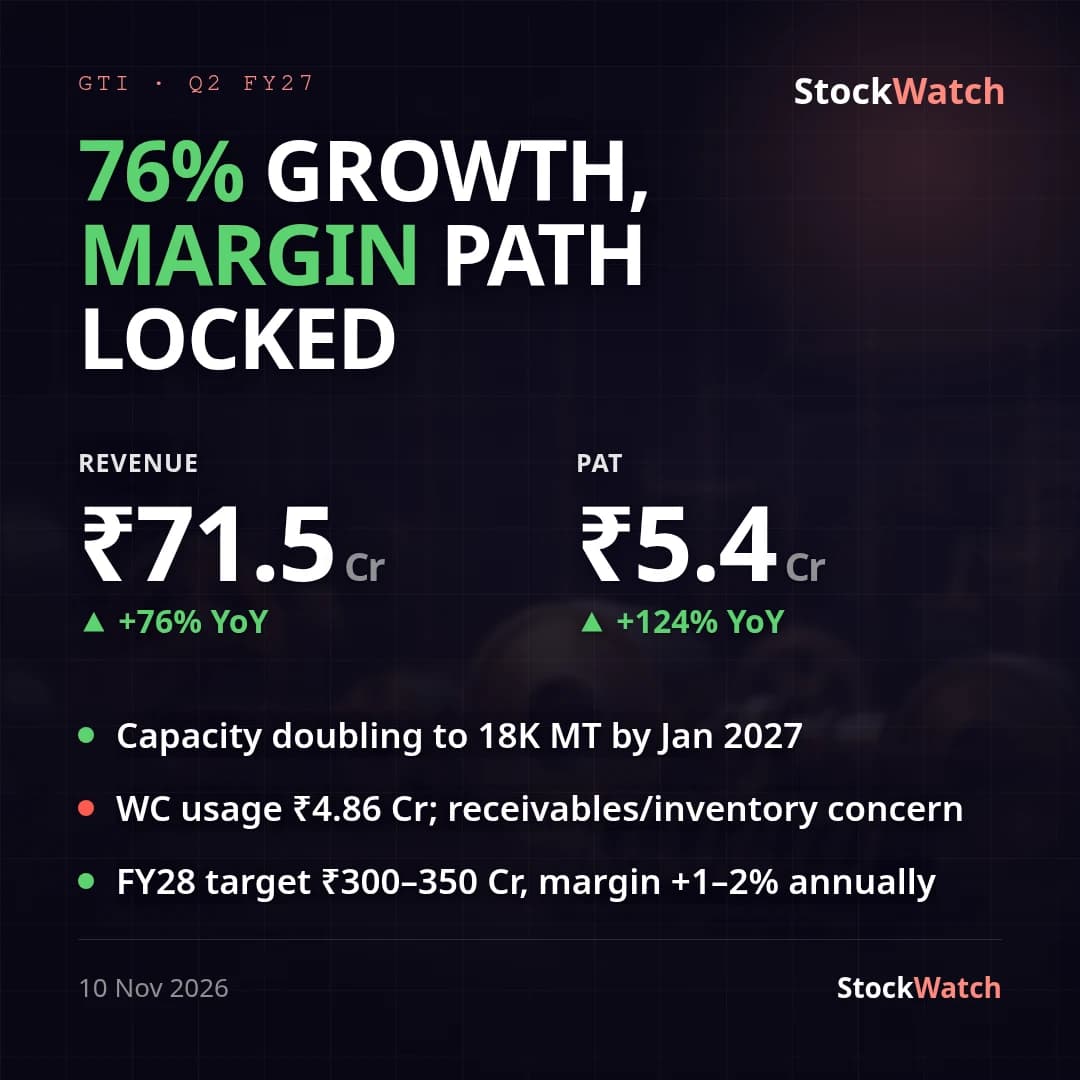 GTILTranscript10 Nov
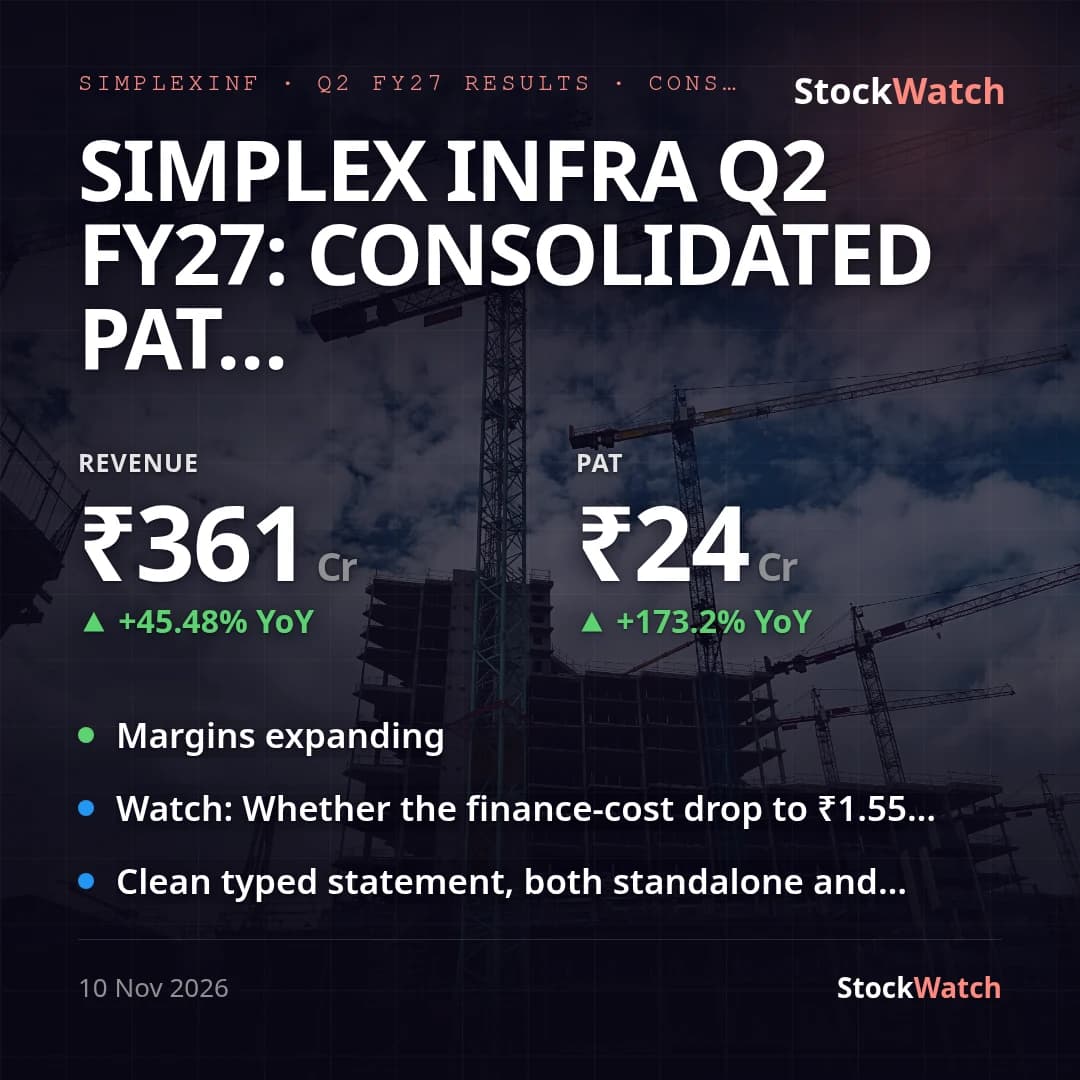 SIMPLEXINFResults10 Nov
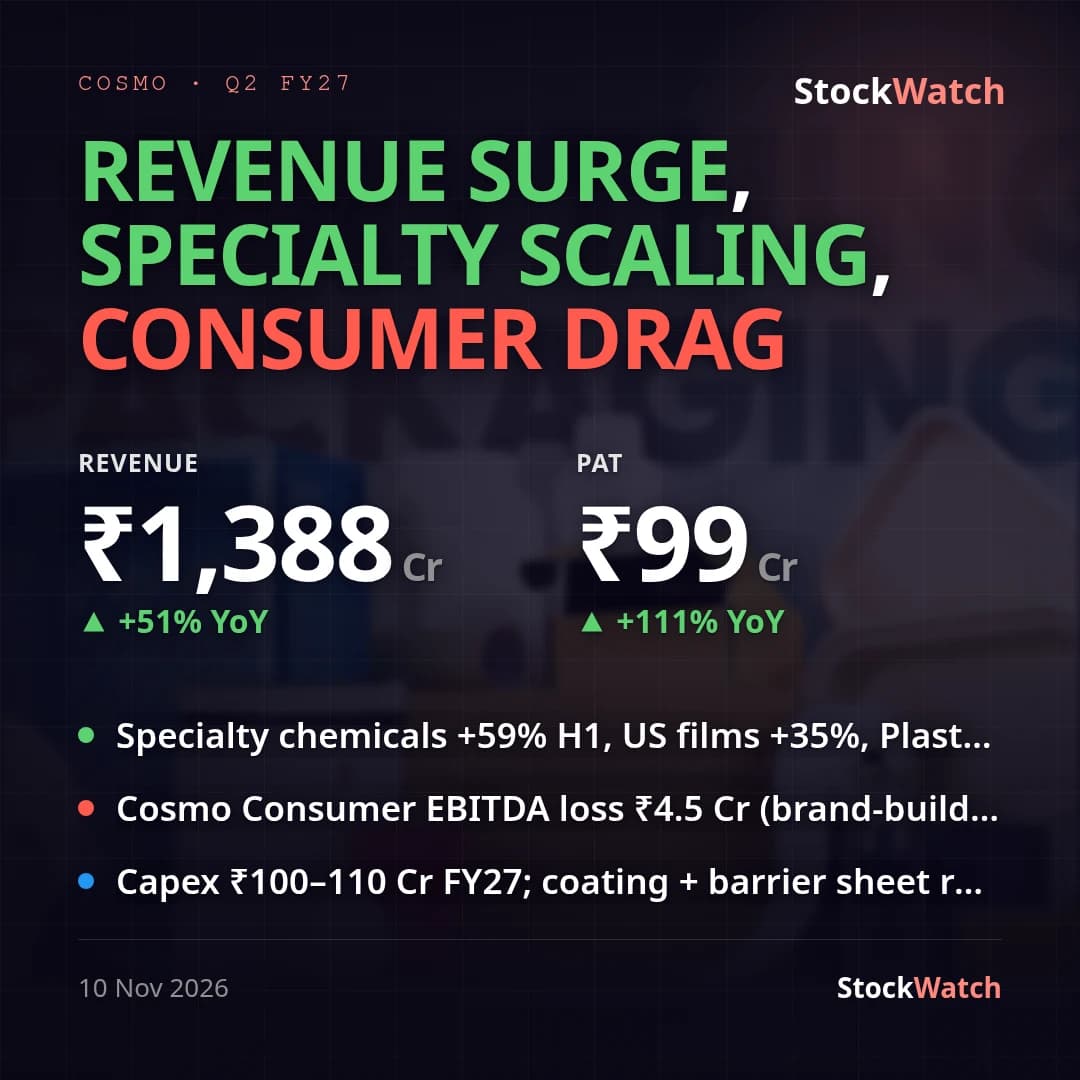 COSMOFIRSTResult verdict10 Nov
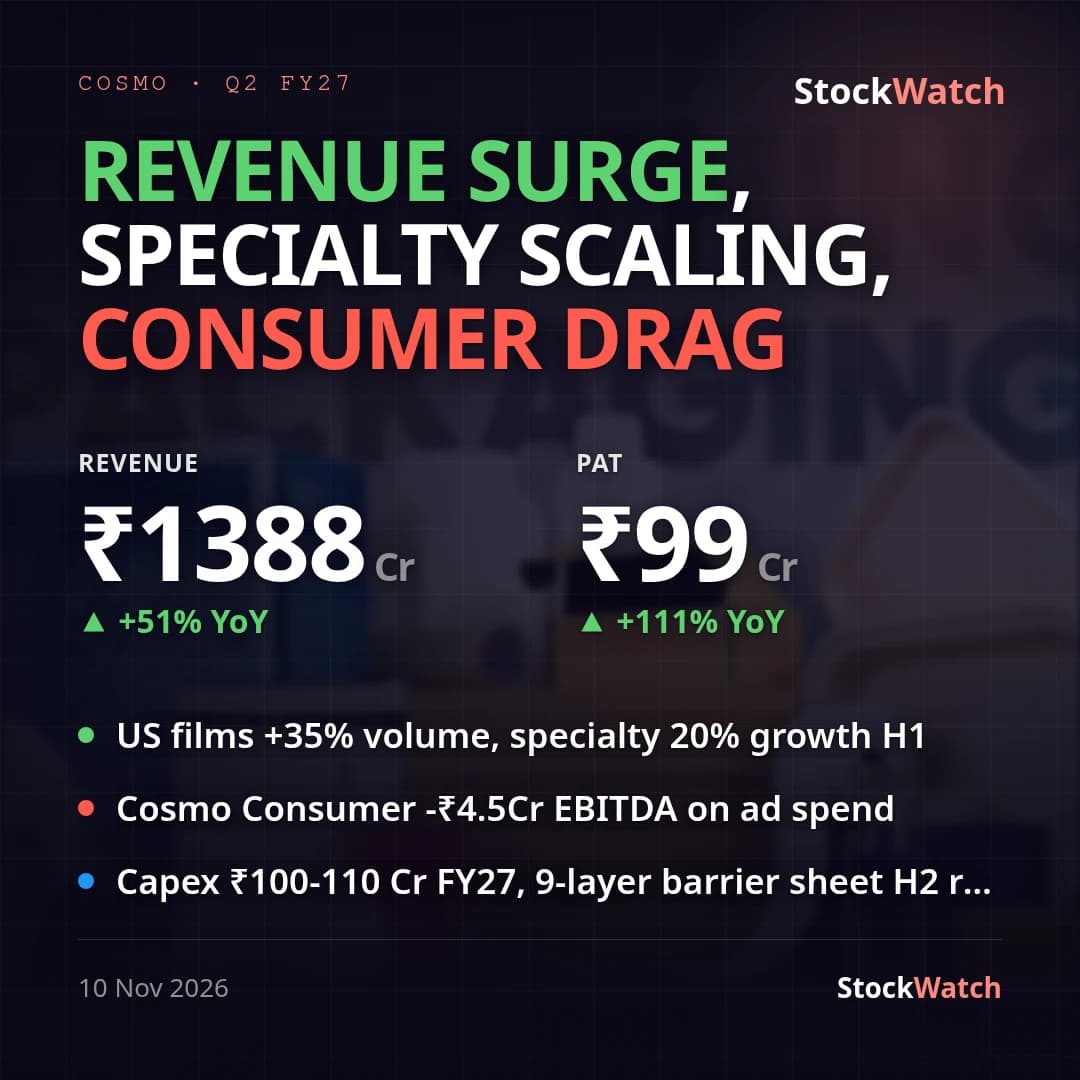 COSMOFIRSTTranscript10 Nov
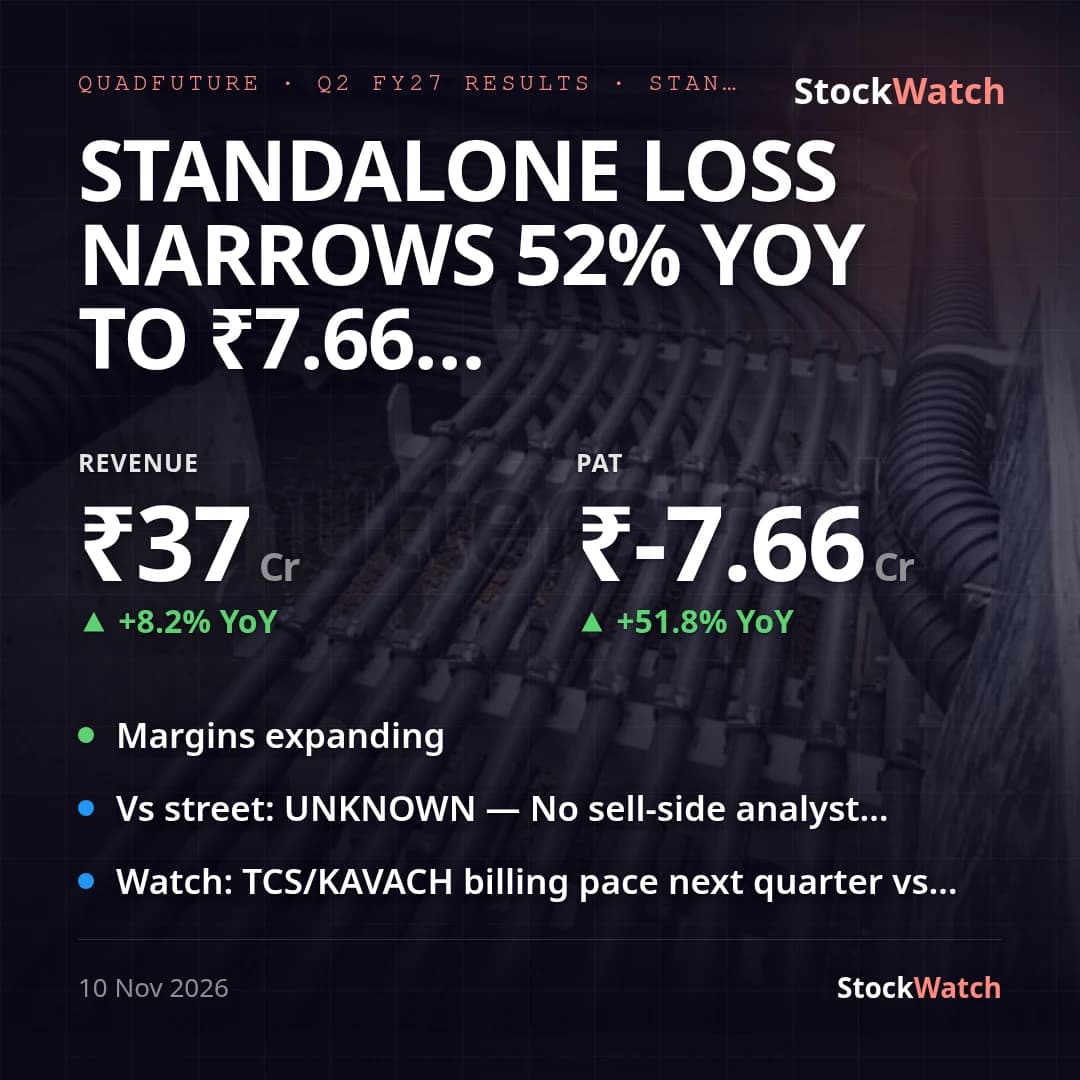 QUADFUTUREResults10 Nov
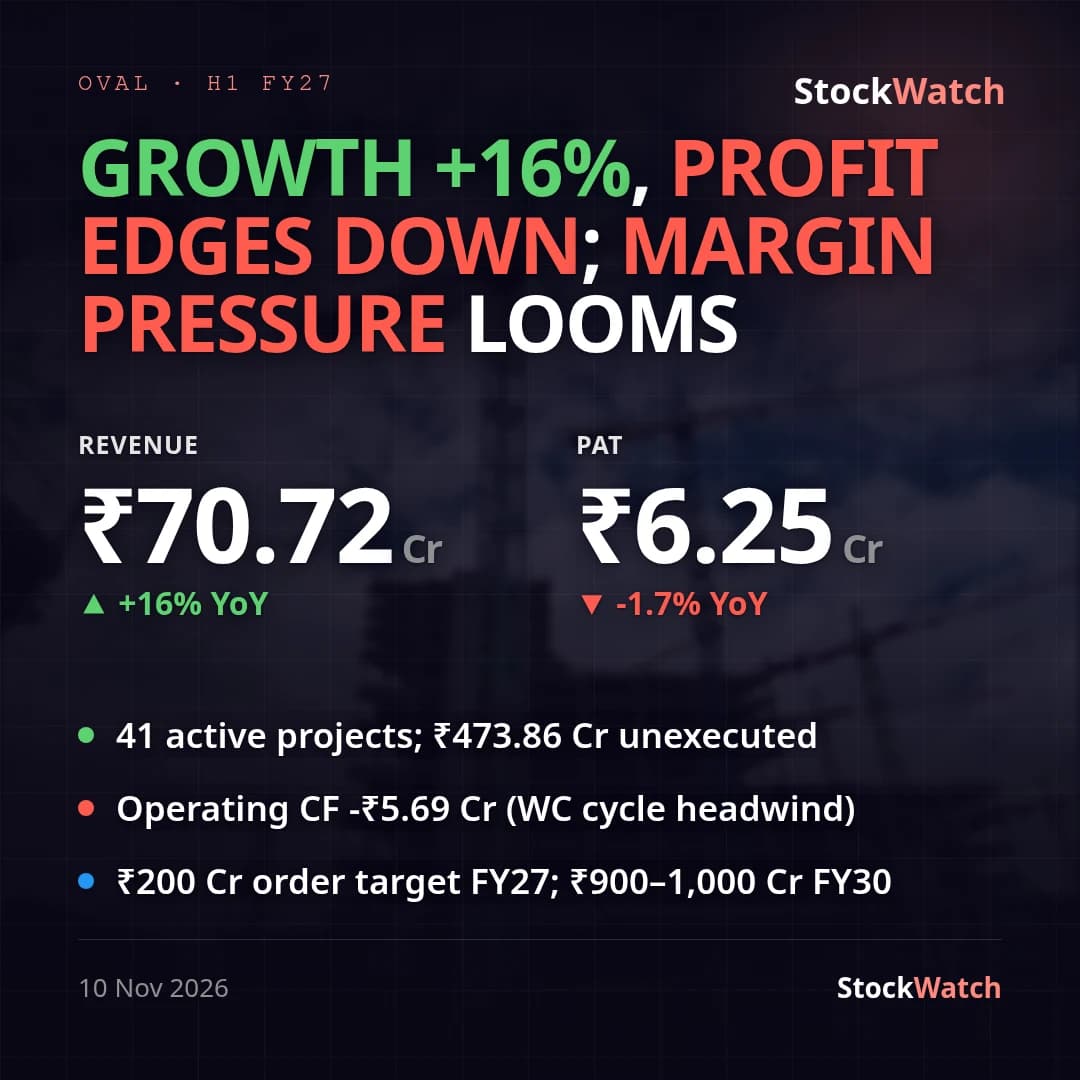 OVALResult verdict10 Nov
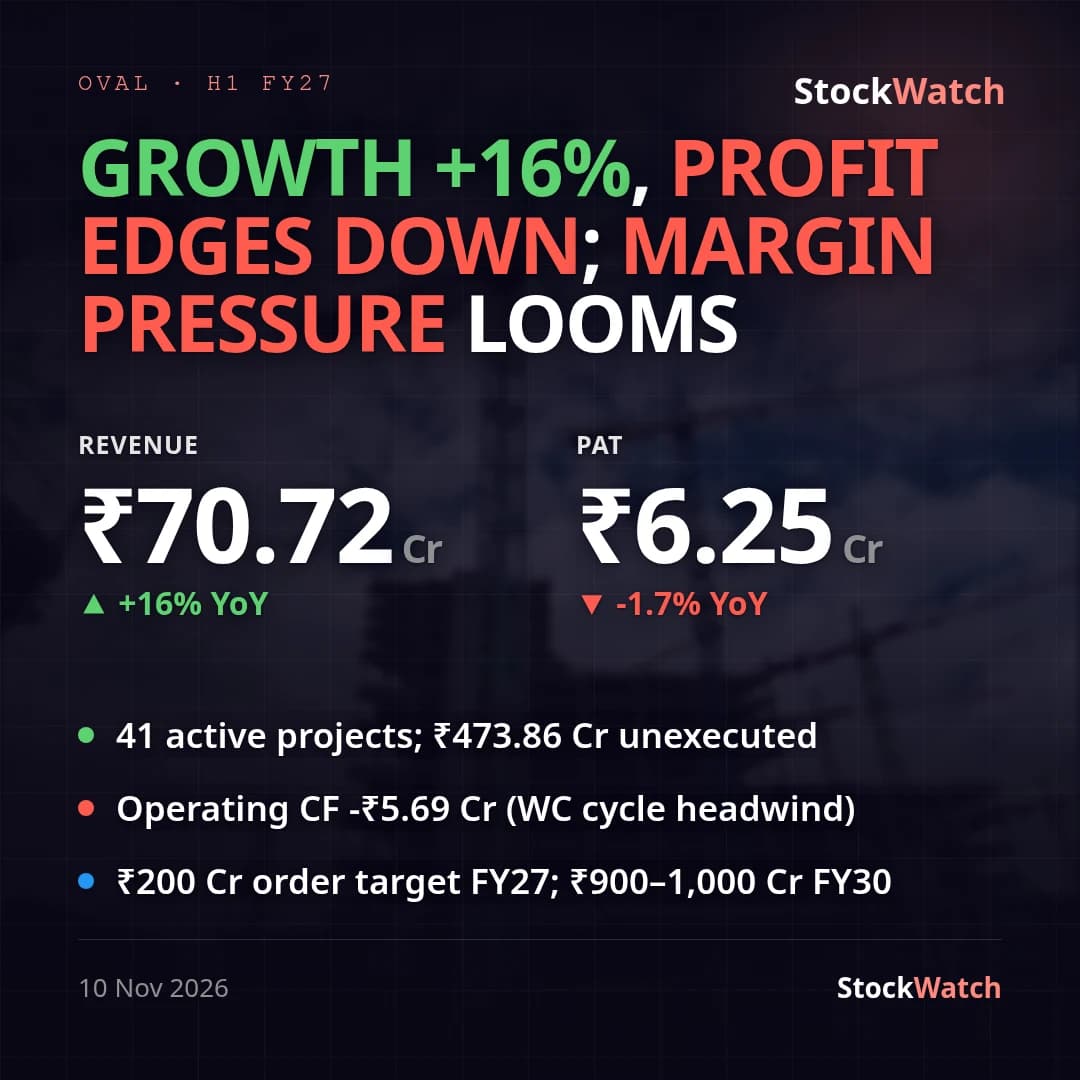 OVALTranscript10 Nov
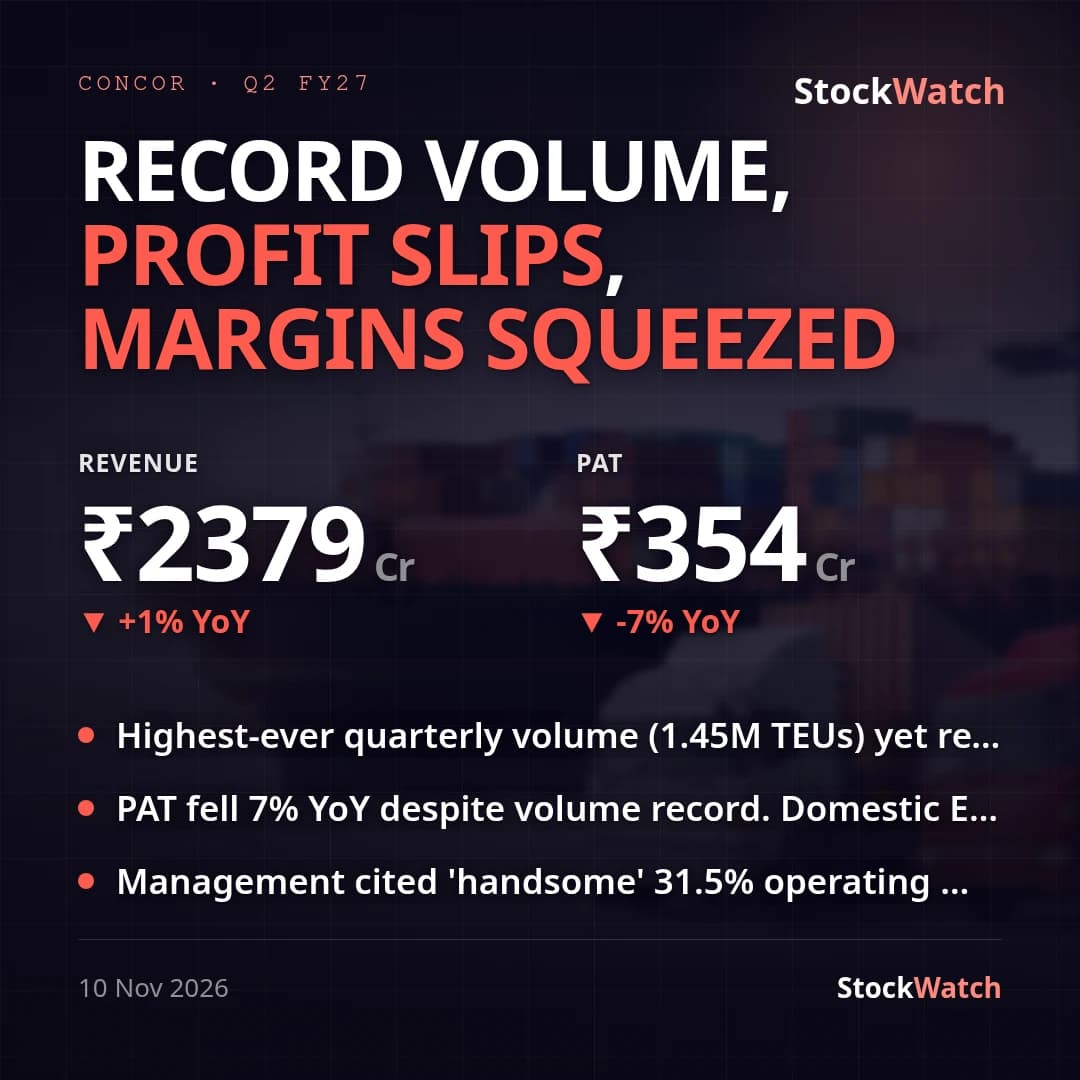 CONCORResult verdict10 Nov
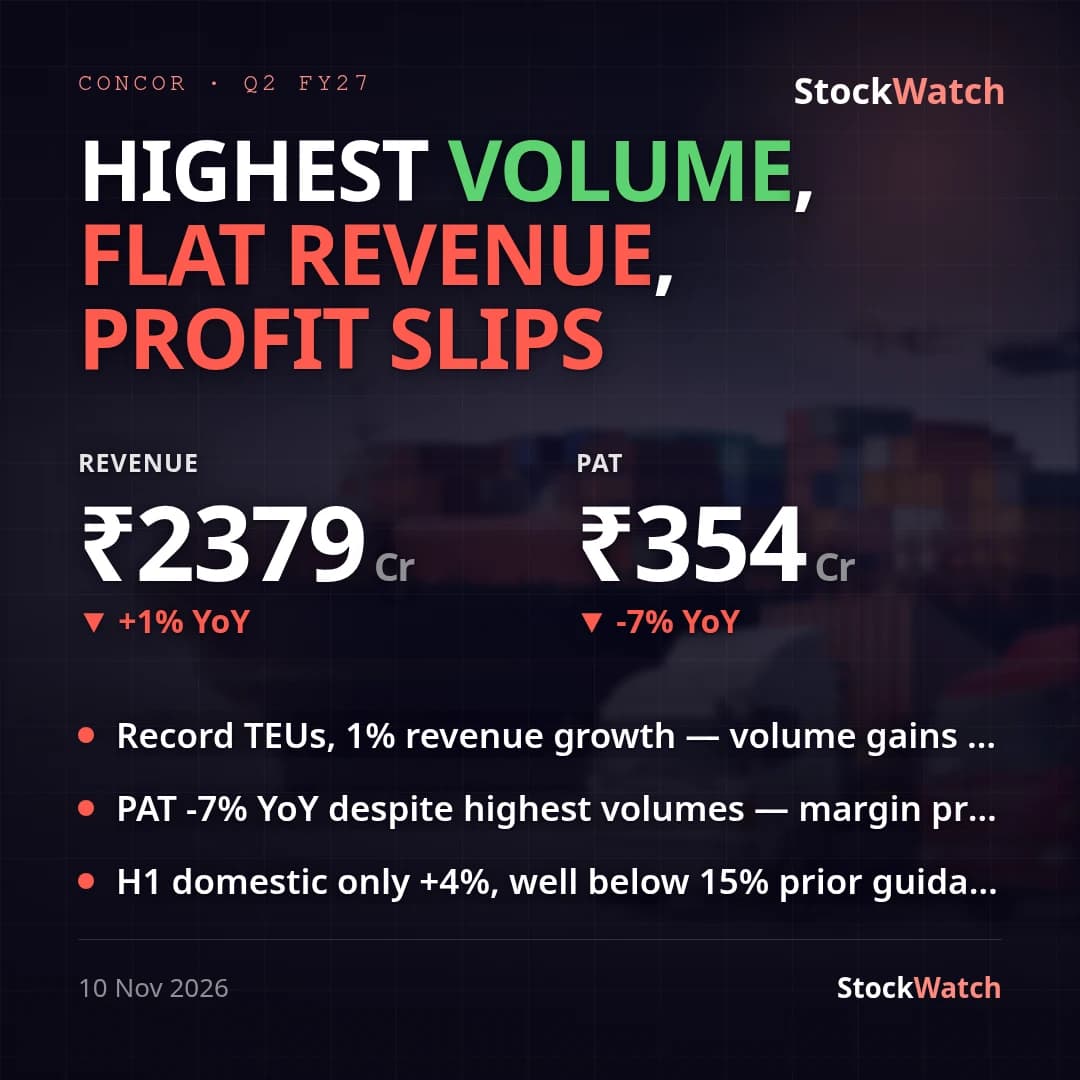 CONCORTranscript10 Nov
 NBCCResult verdict10 Nov
 NBCCTranscript10 Nov
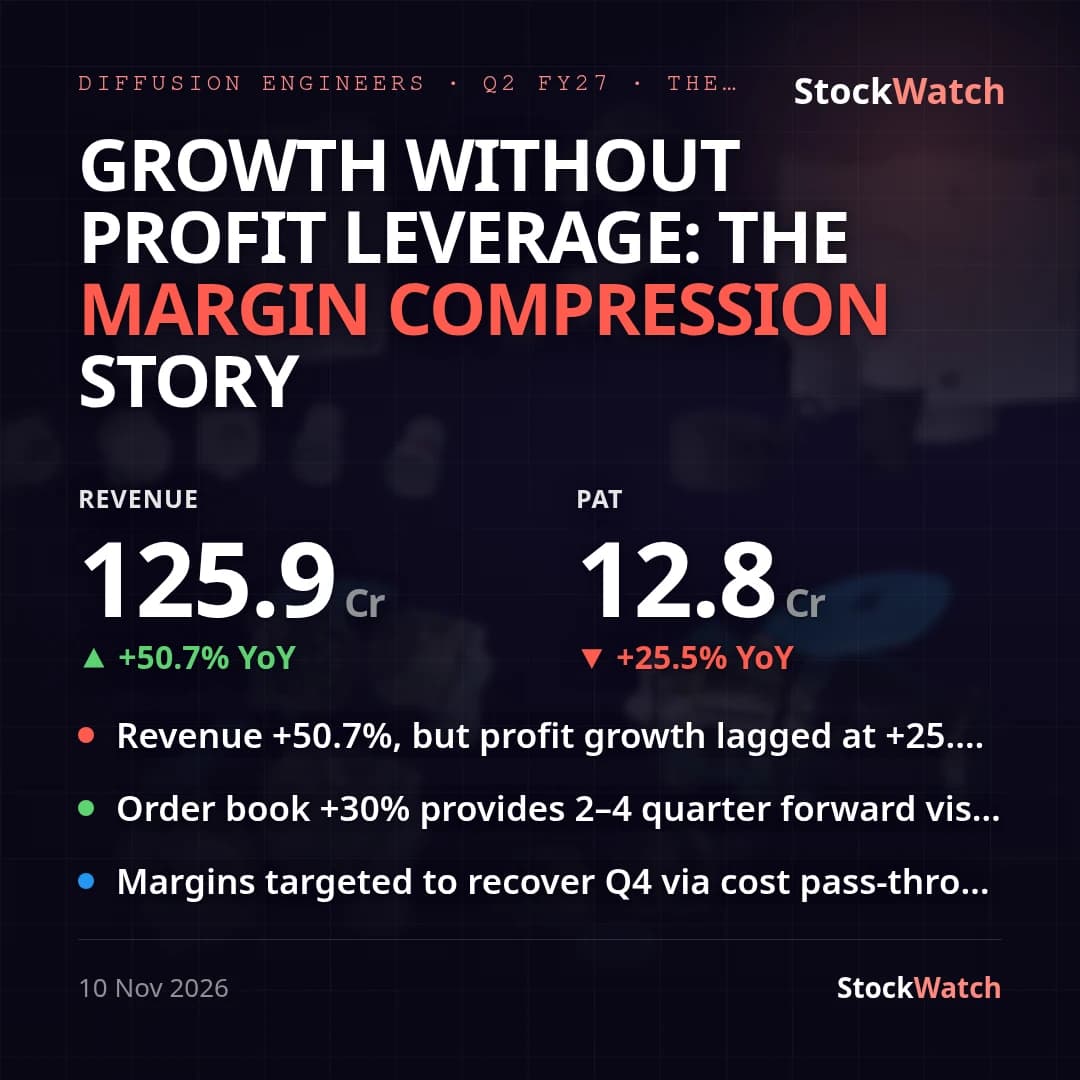 DIFFNKGResult verdict10 Nov
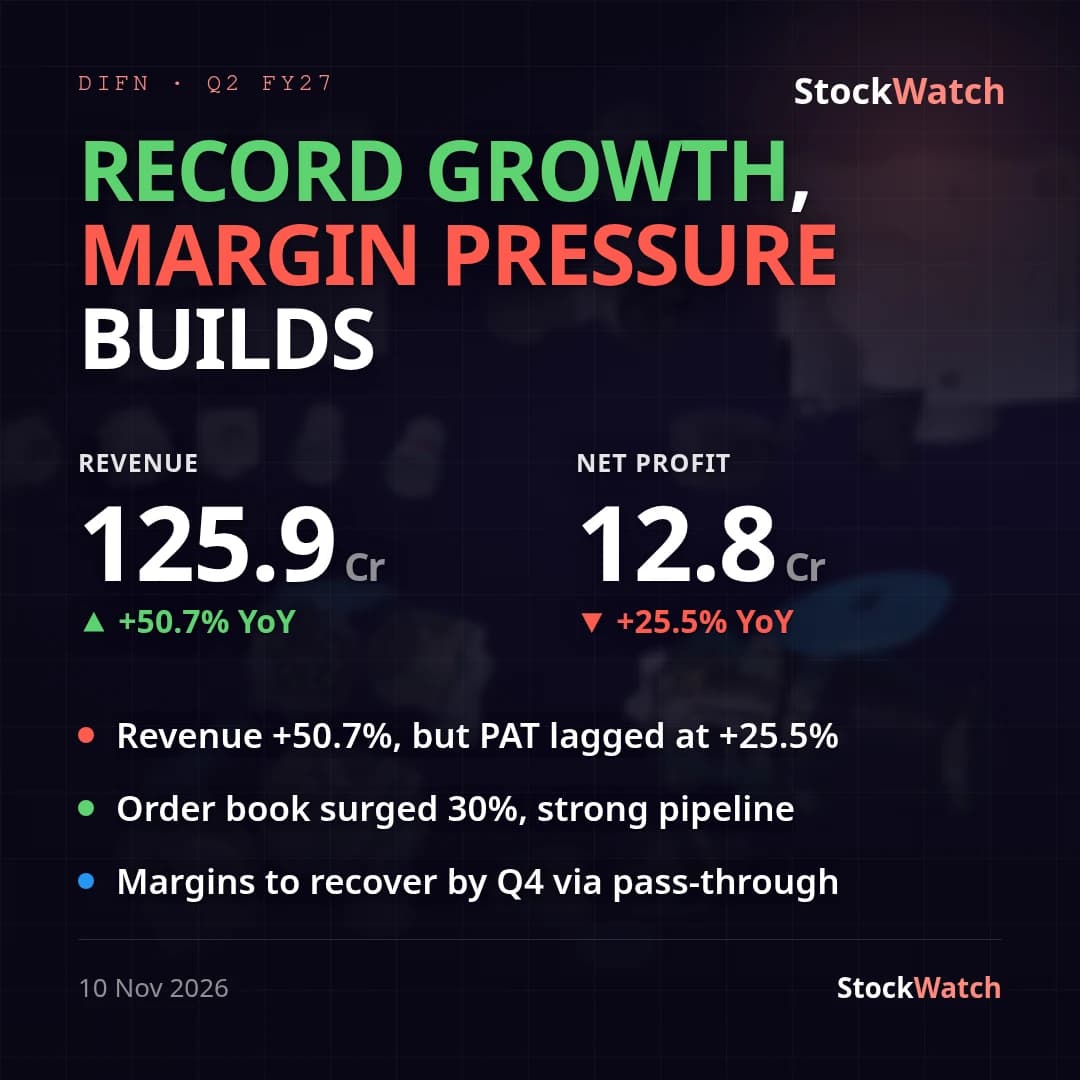 DIFFNKGTranscript10 Nov
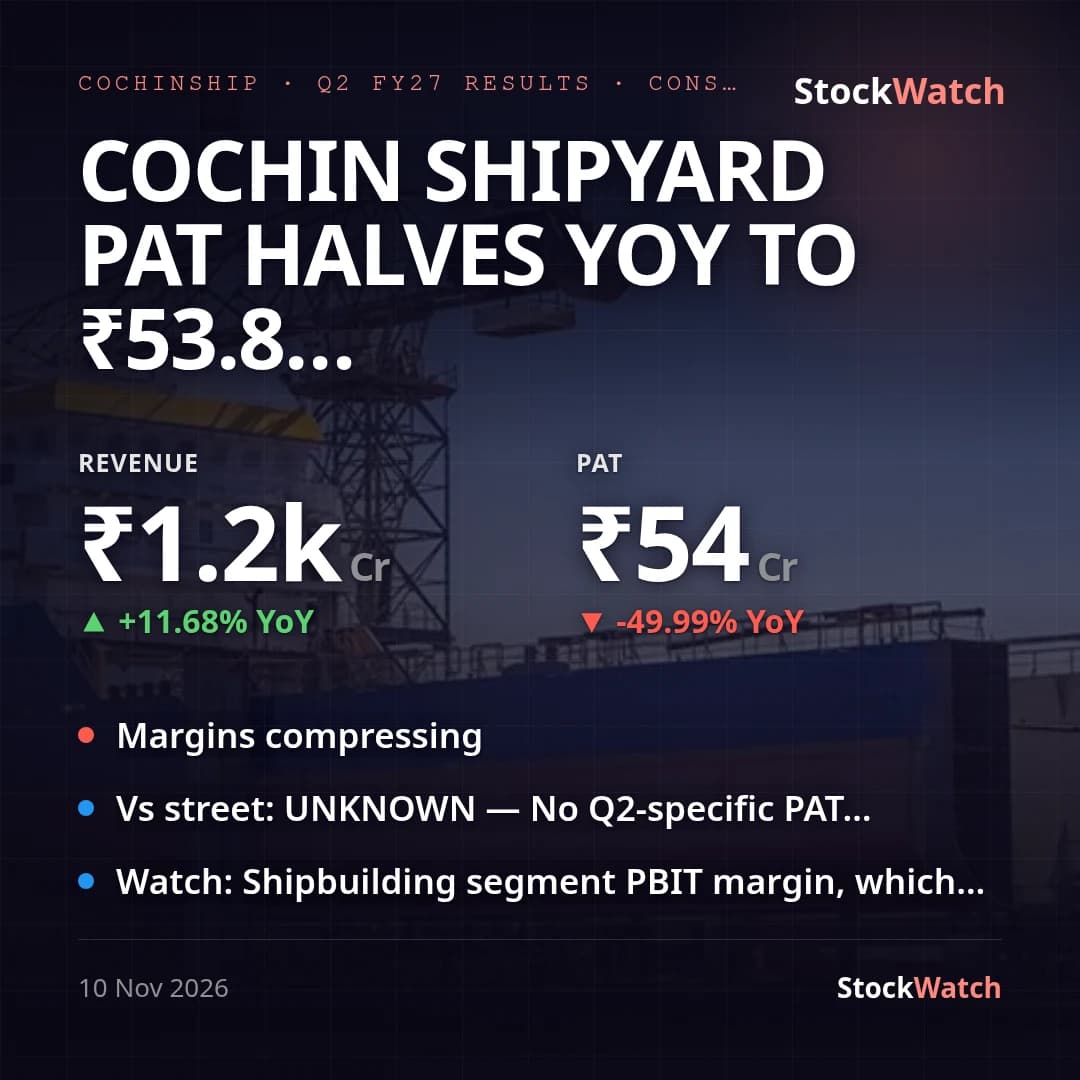 COCHINSHIPResults10 Nov
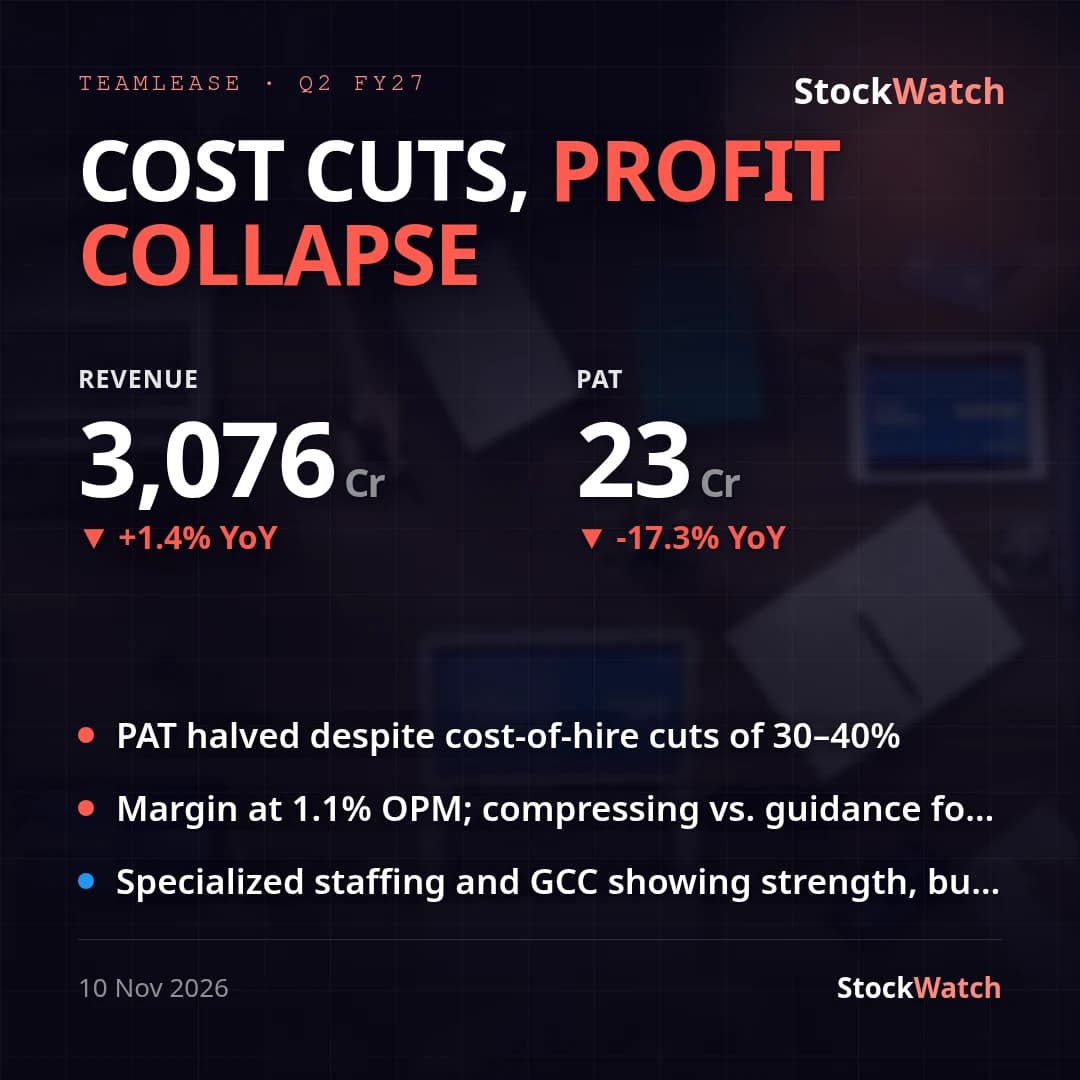 TEAMLEASEResult verdict10 Nov
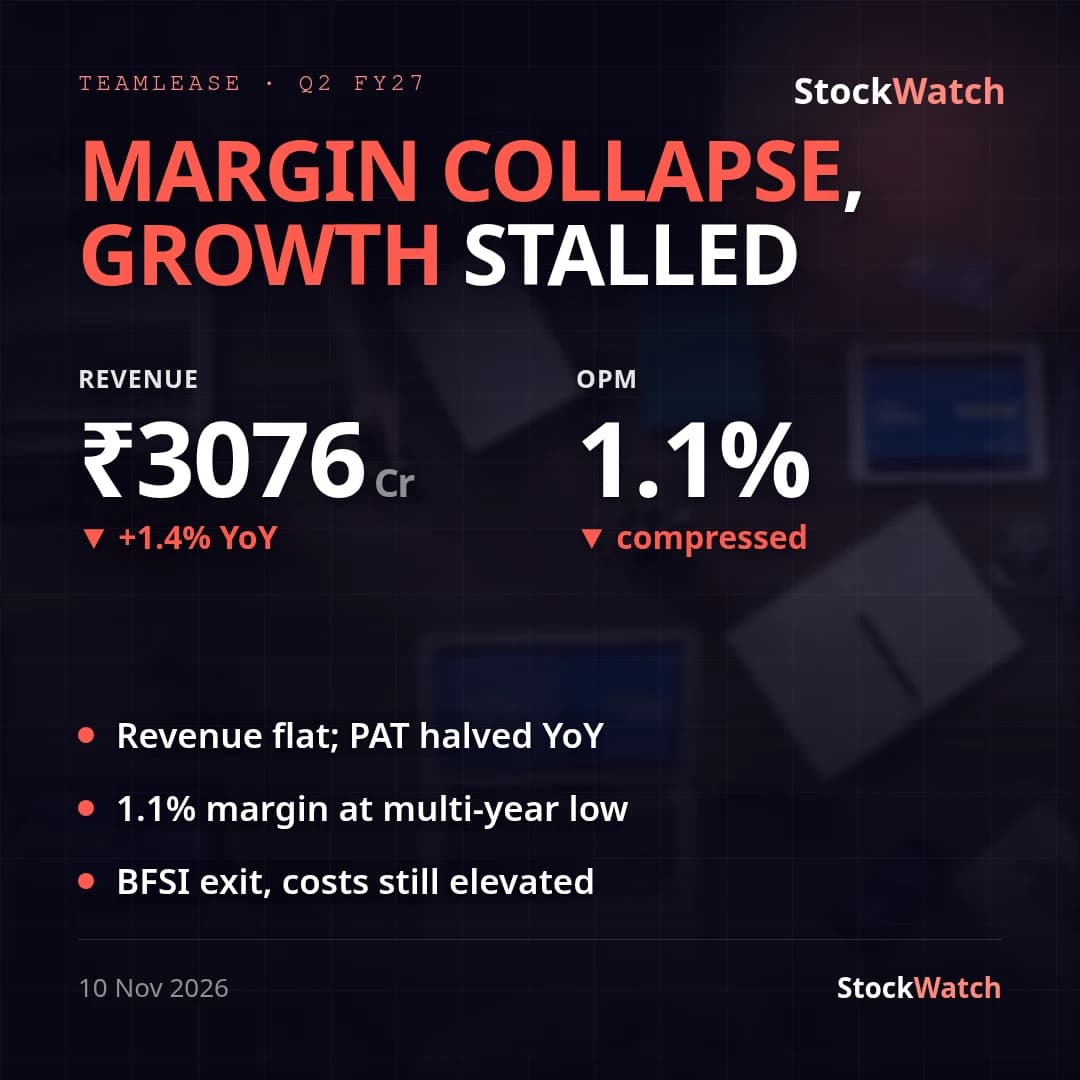 TEAMLEASETranscript10 Nov
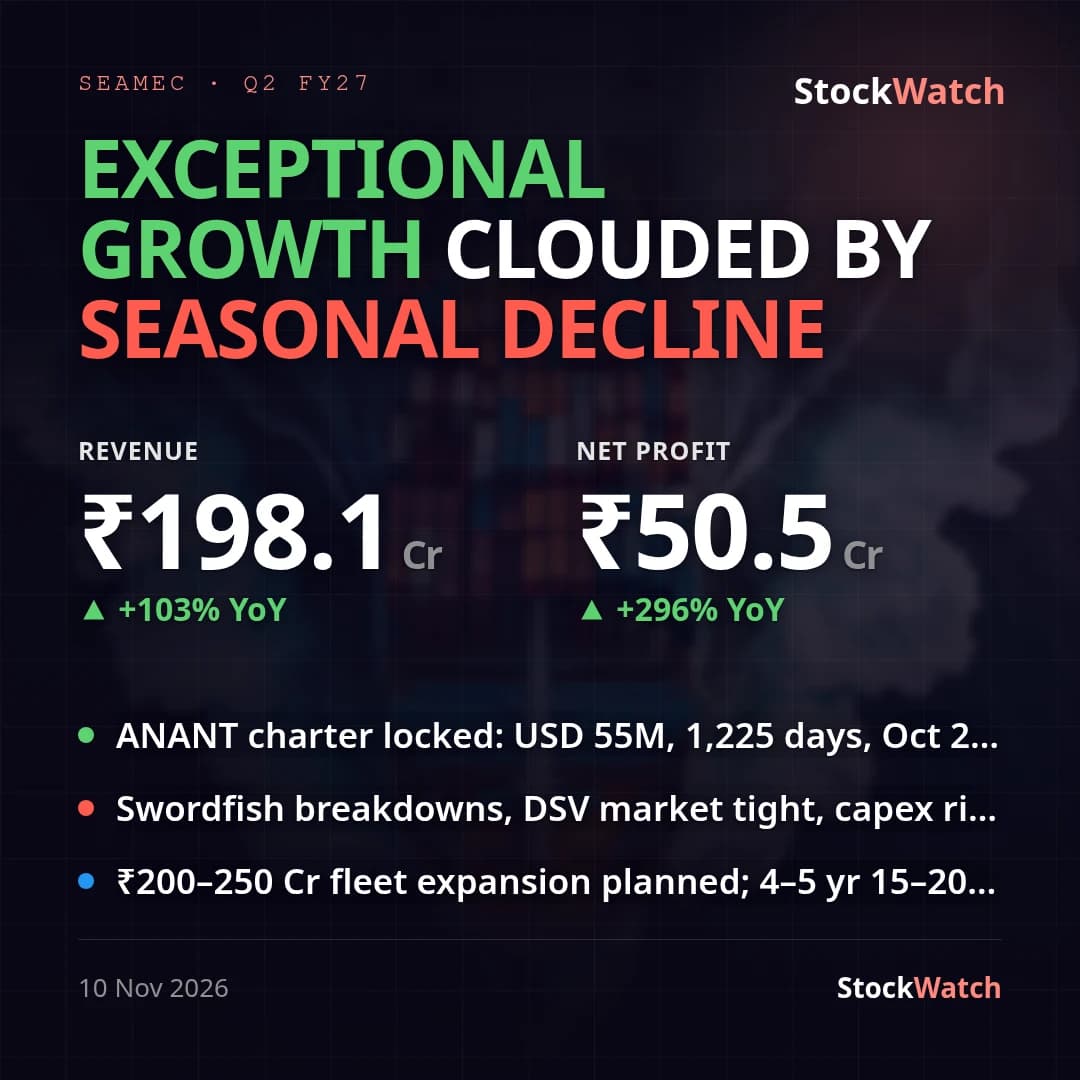 SEAMECLTDResult verdict10 Nov
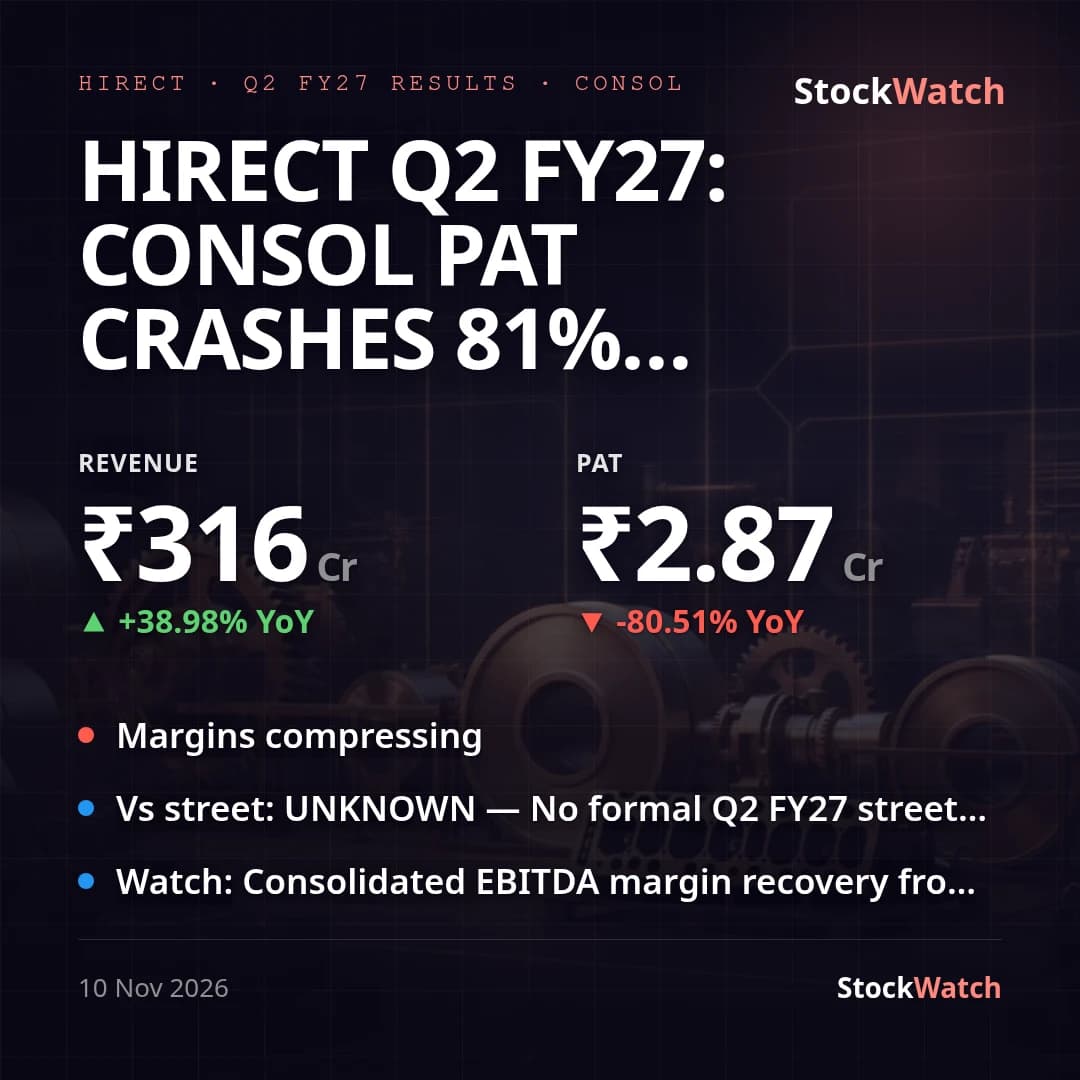 HIRECTResults10 Nov
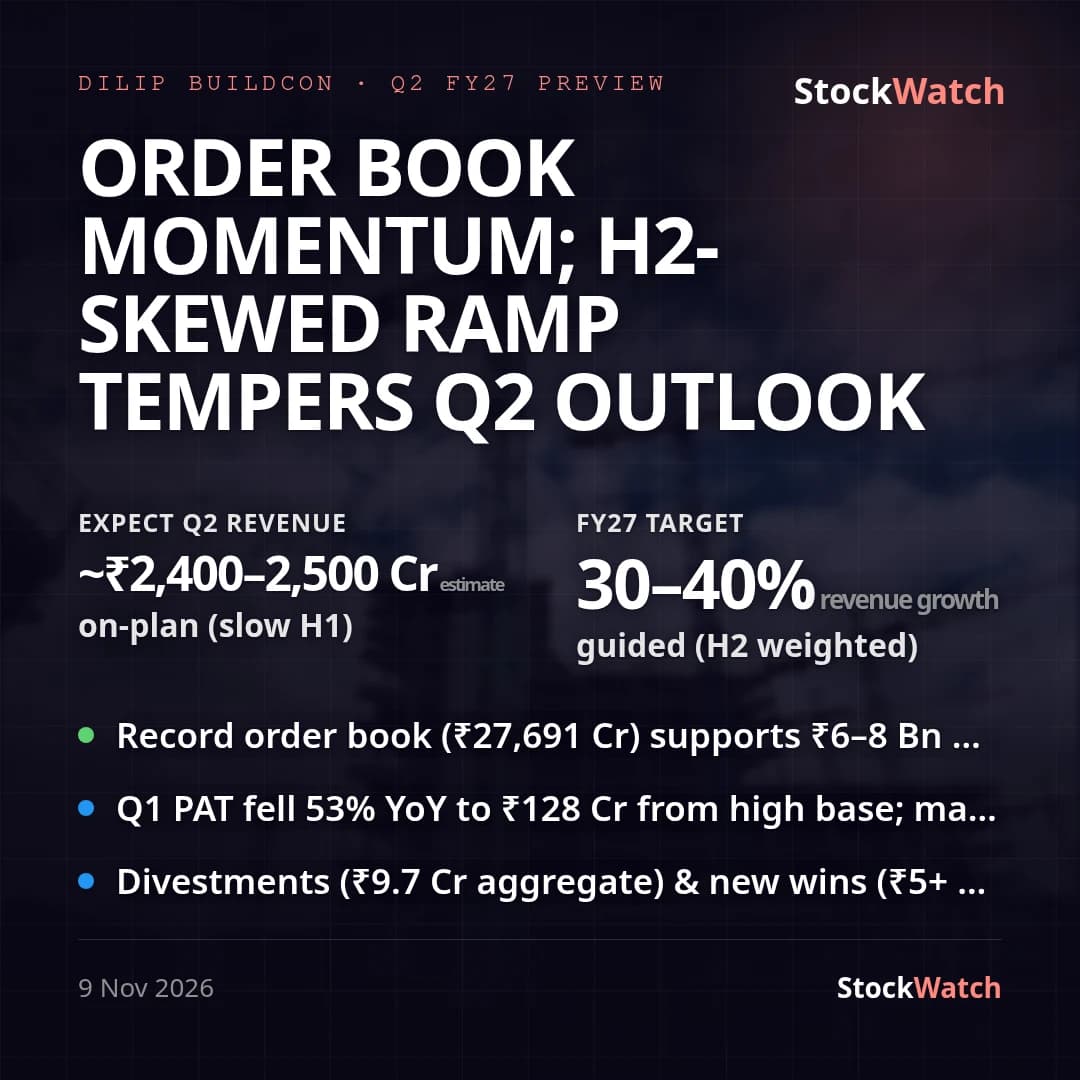 DBLResult preview10 Nov
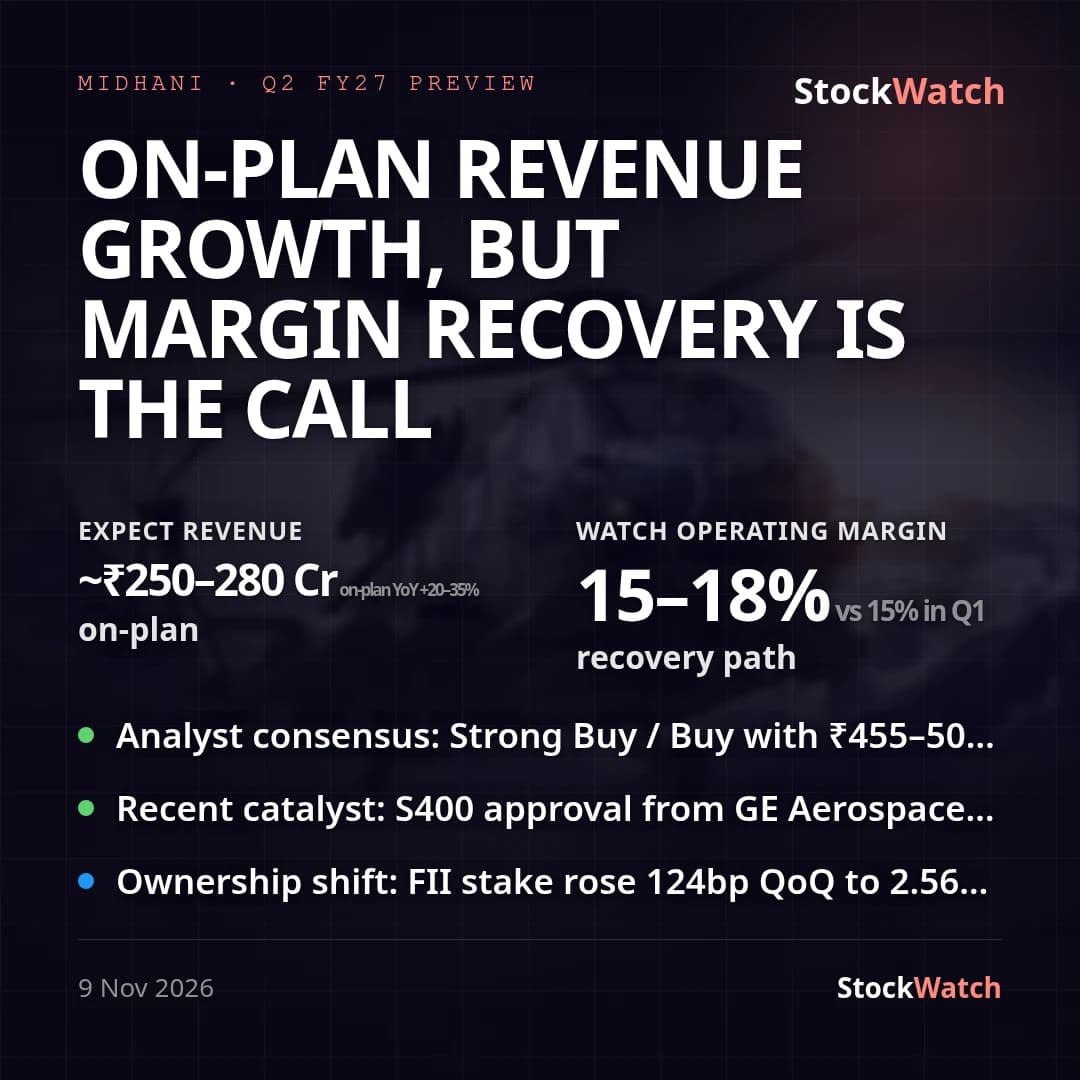 MIDHANIResult preview10 Nov
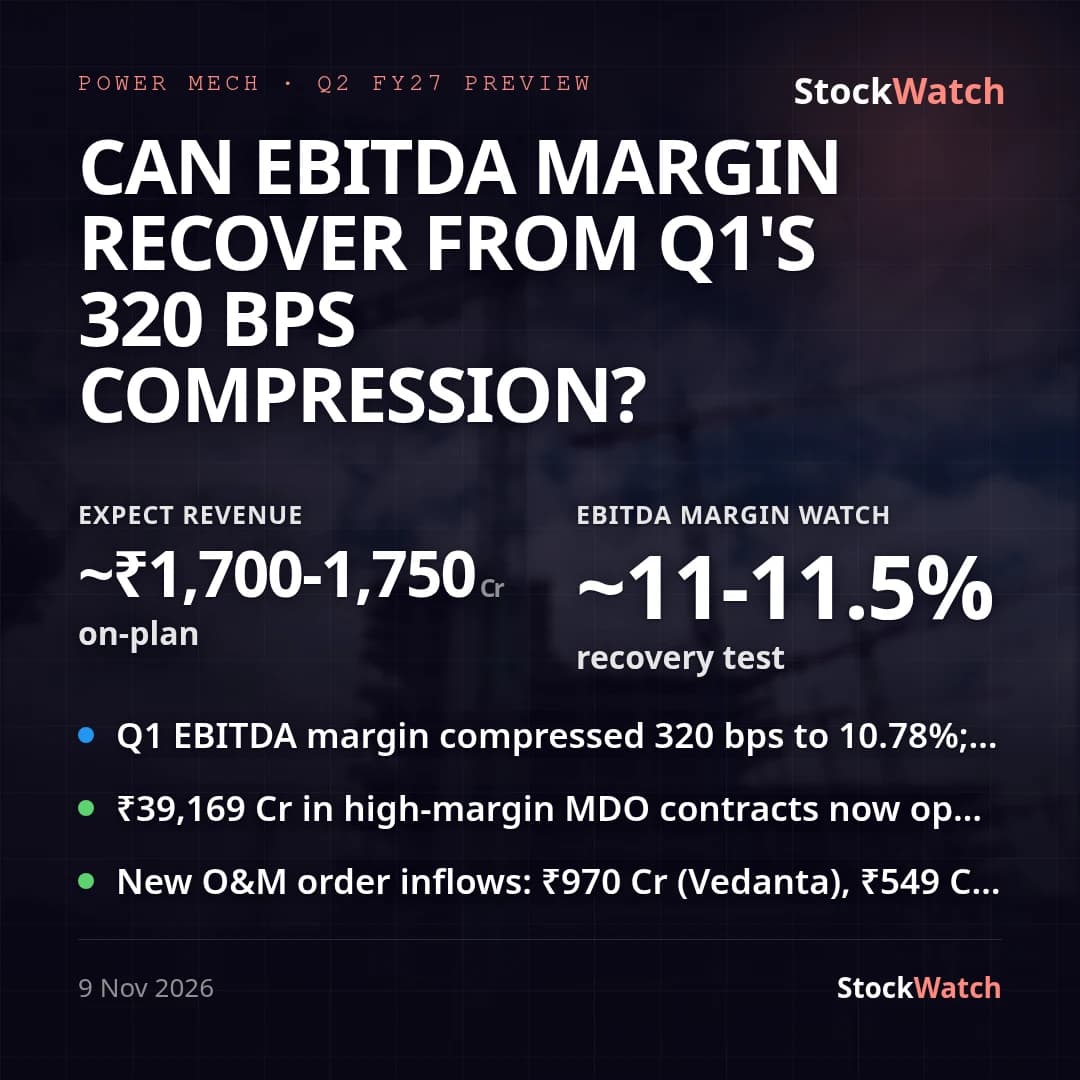 POWERMECHResult preview10 Nov
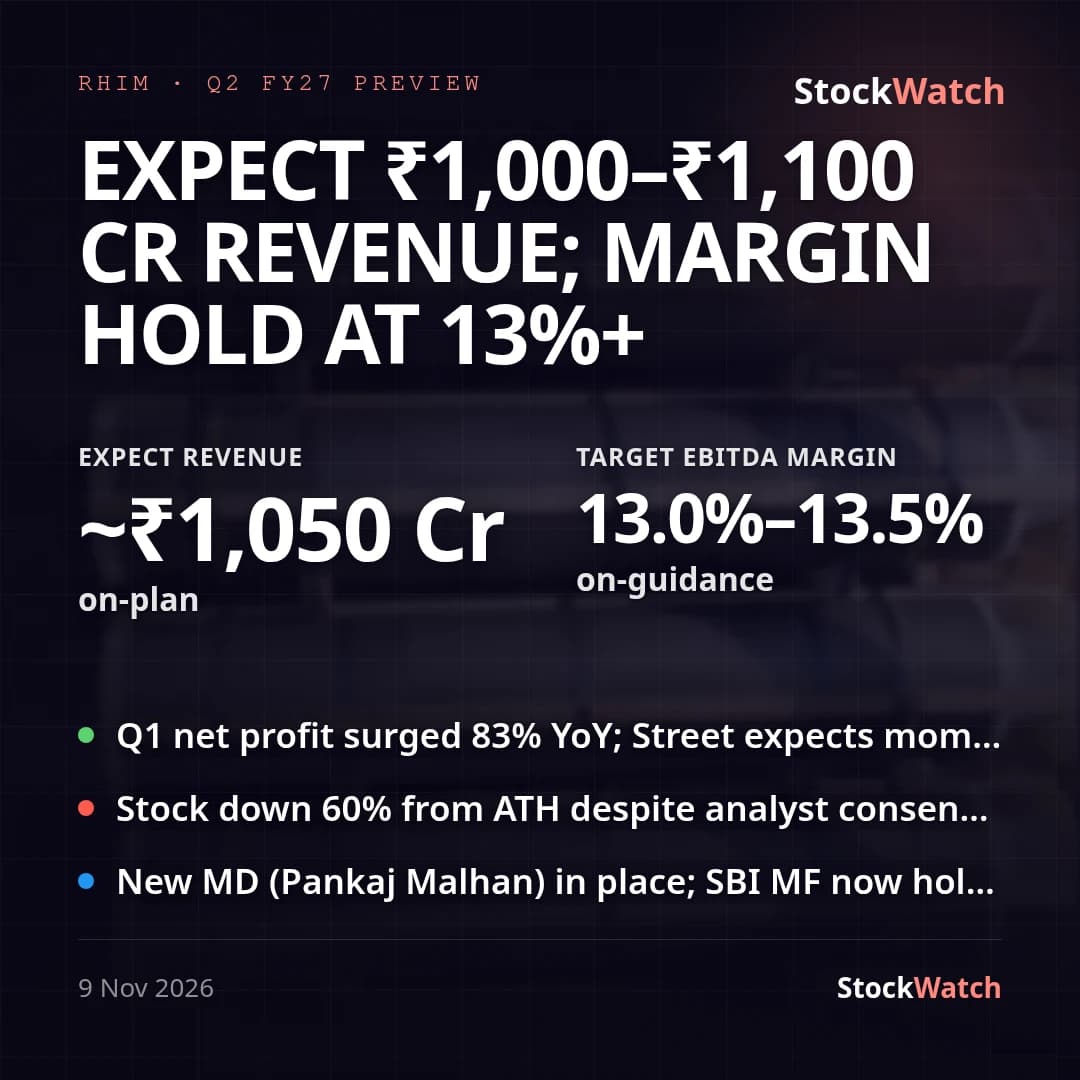 RHIMResult preview10 Nov
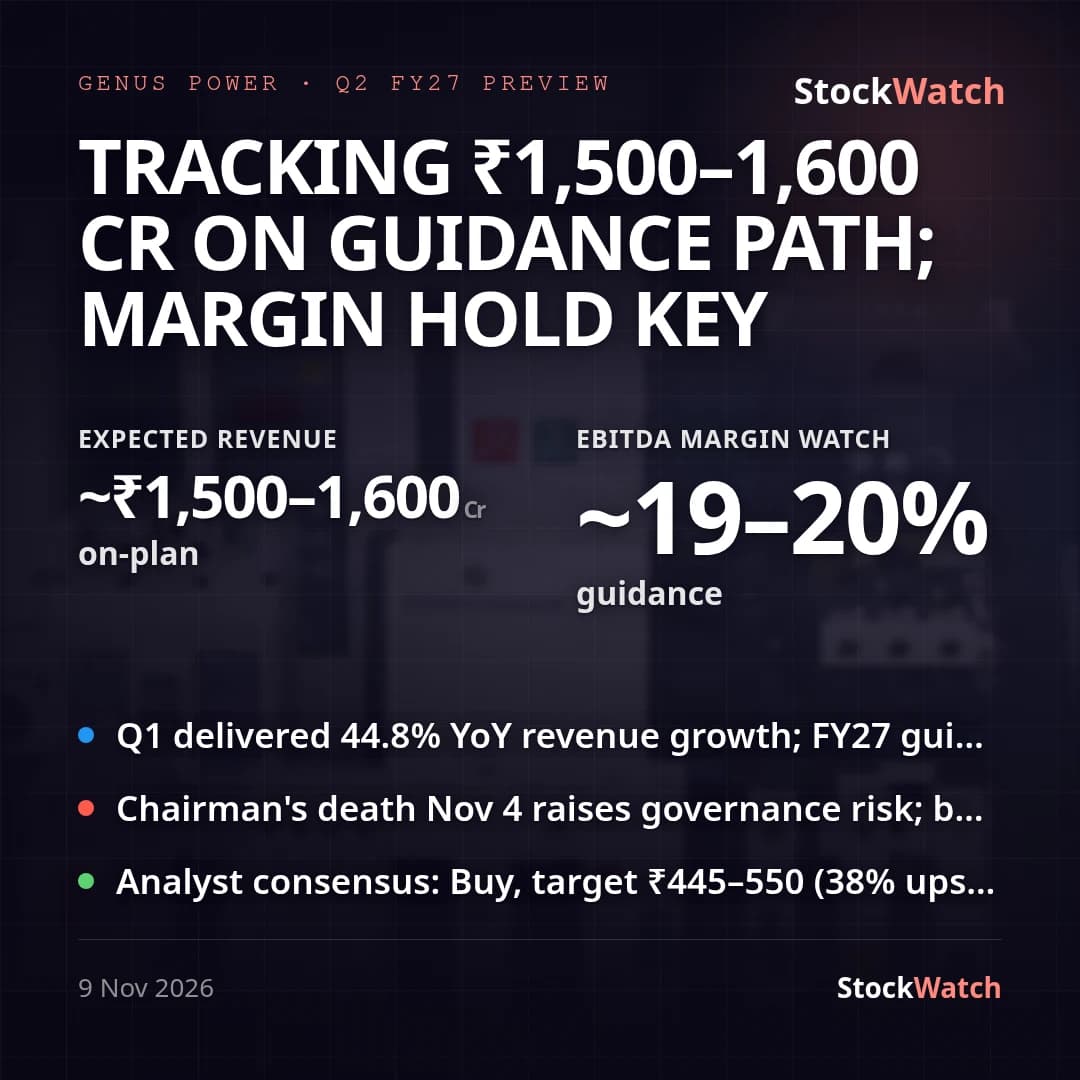 GENUSPOWERResult preview10 Nov
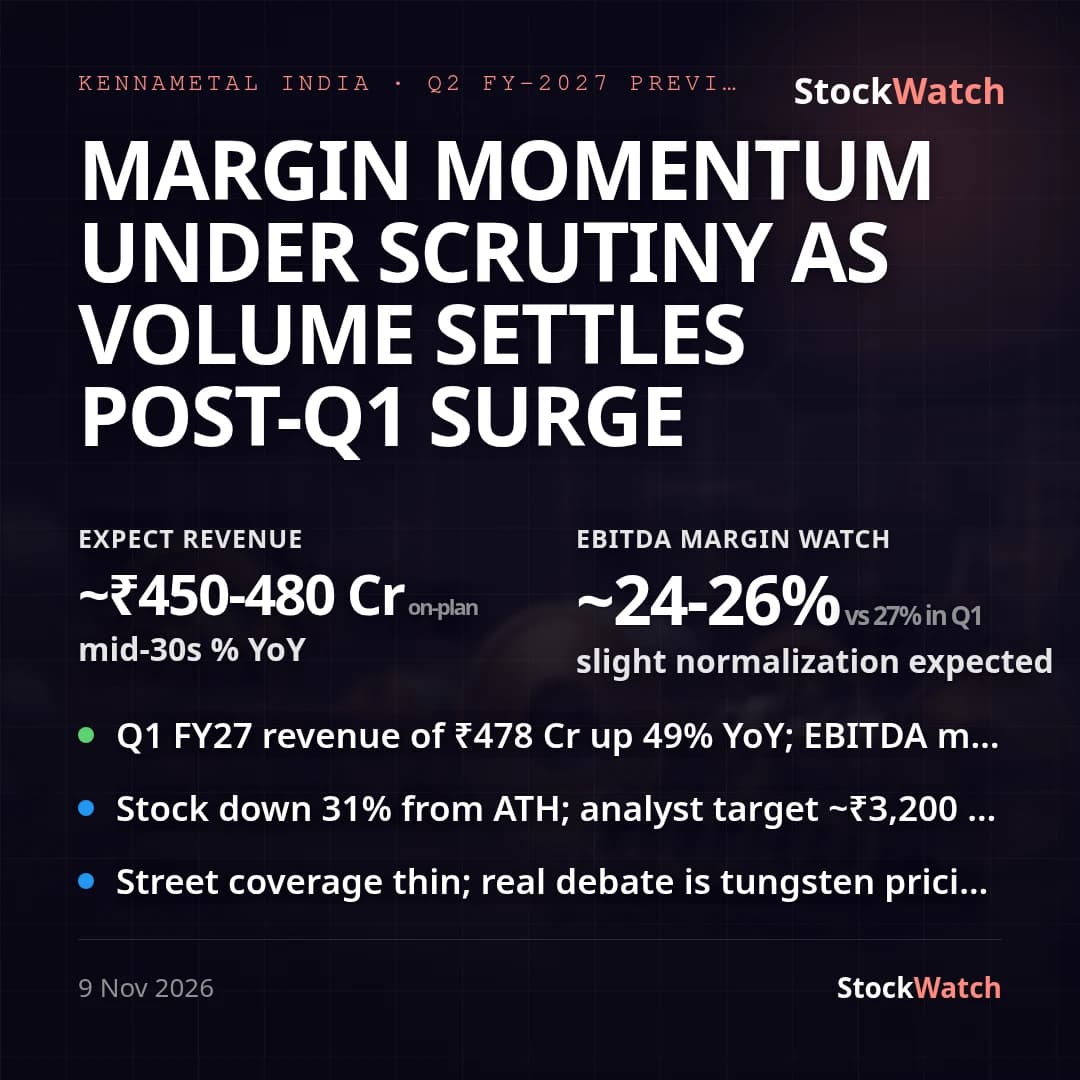 KENNAMETResult preview10 Nov
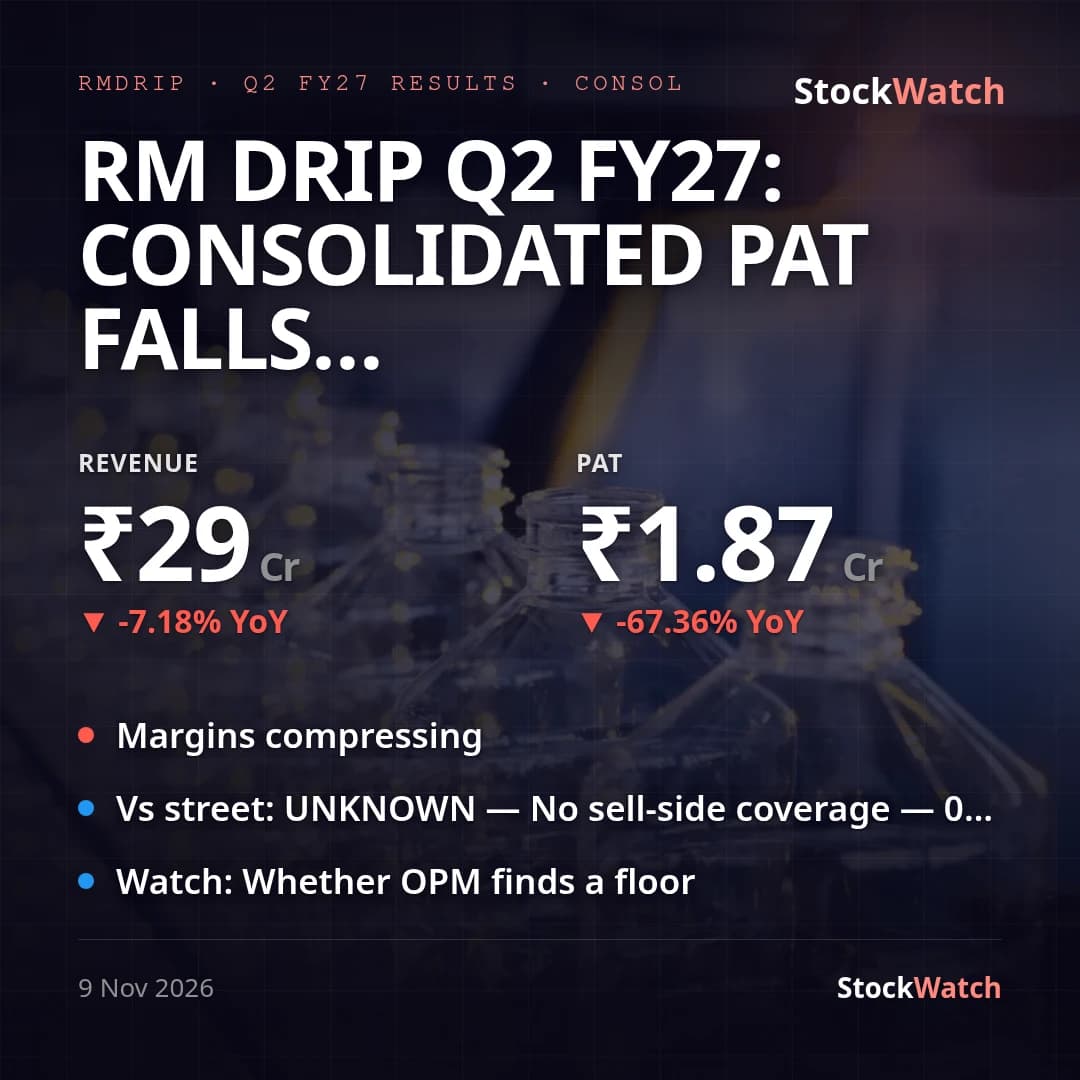 RMDRIPResults9 Nov
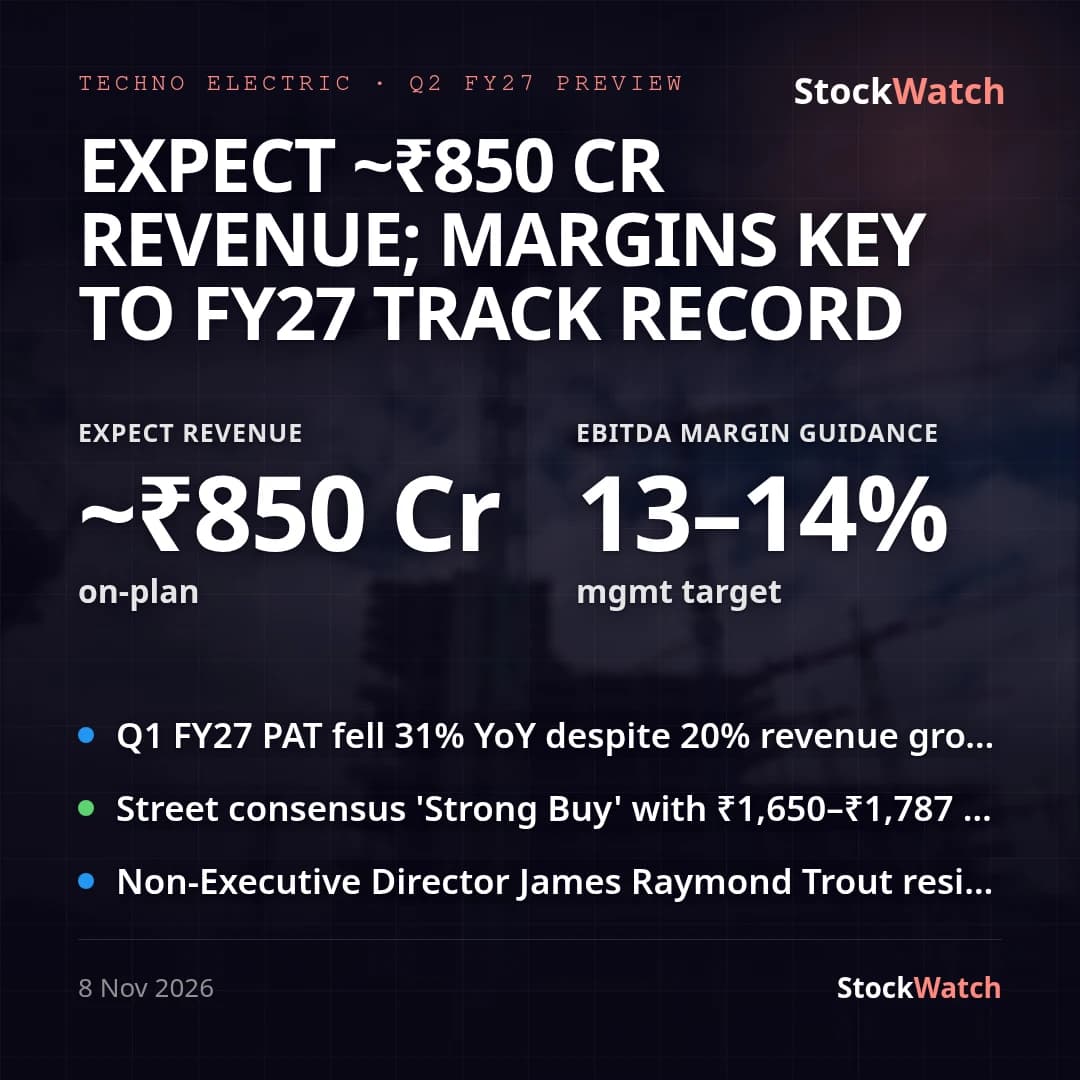 TECHNOEResult preview9 Nov
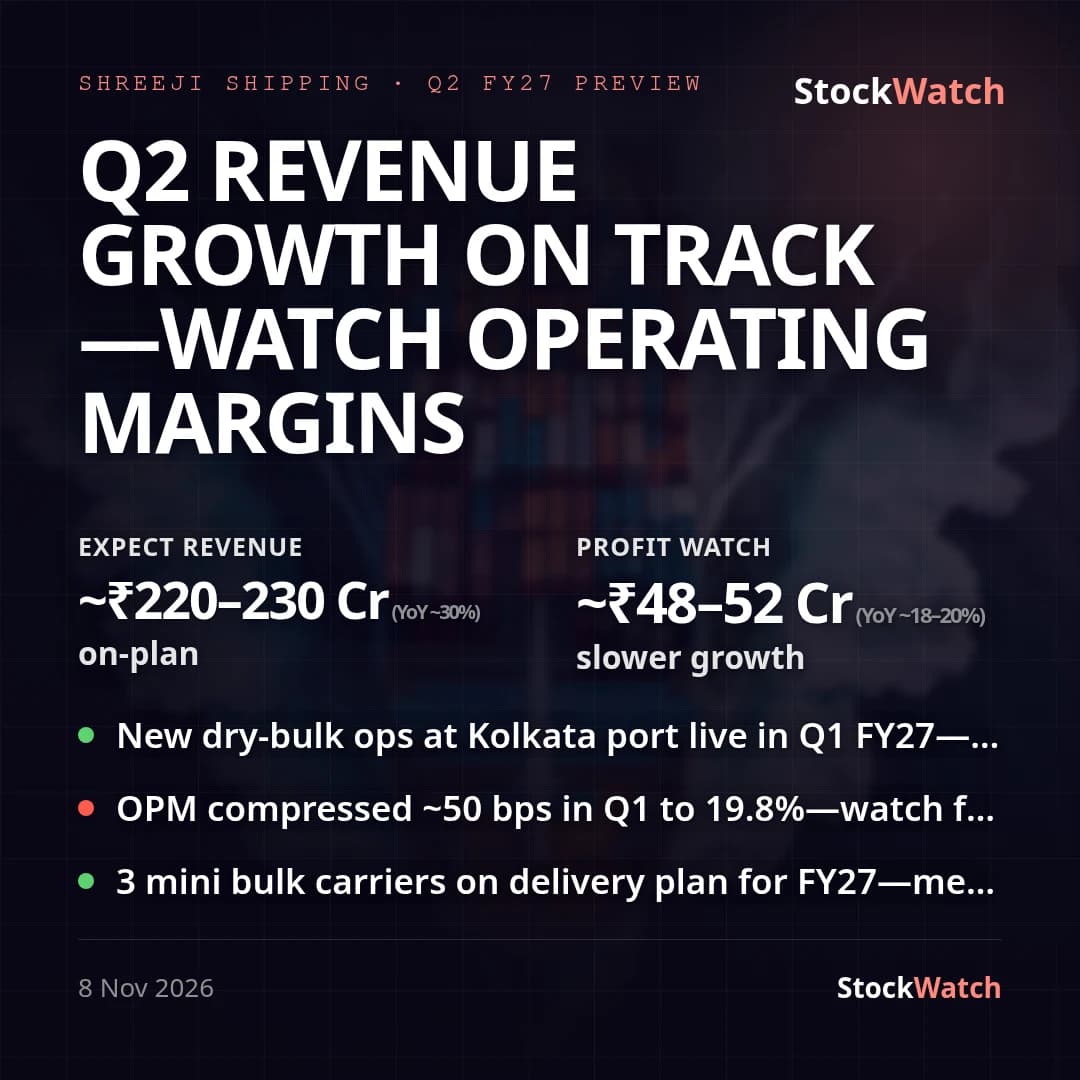 SHREEJISPGResult preview9 Nov
 INOXWINDResult preview9 Nov
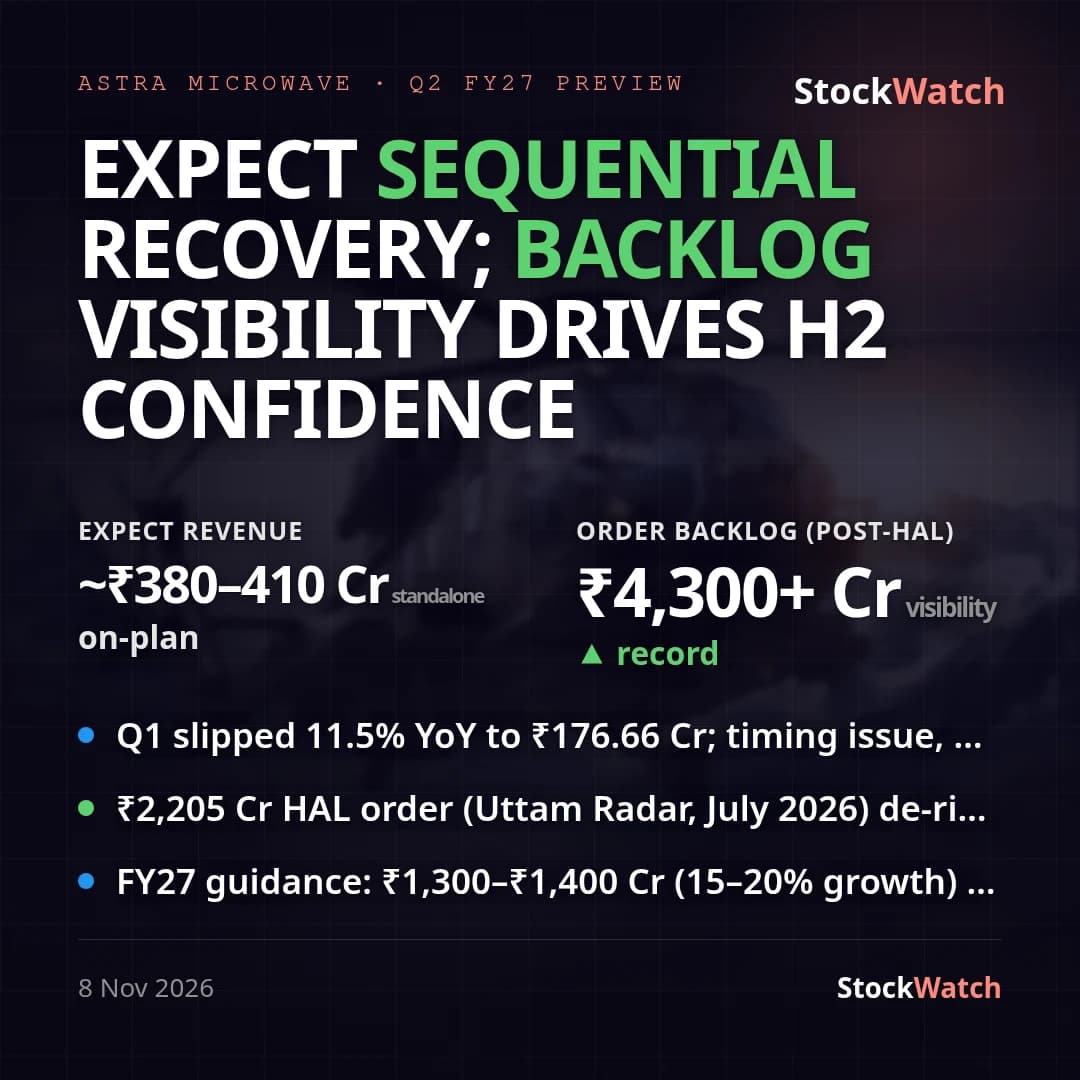 ASTRAMICROResult preview9 Nov
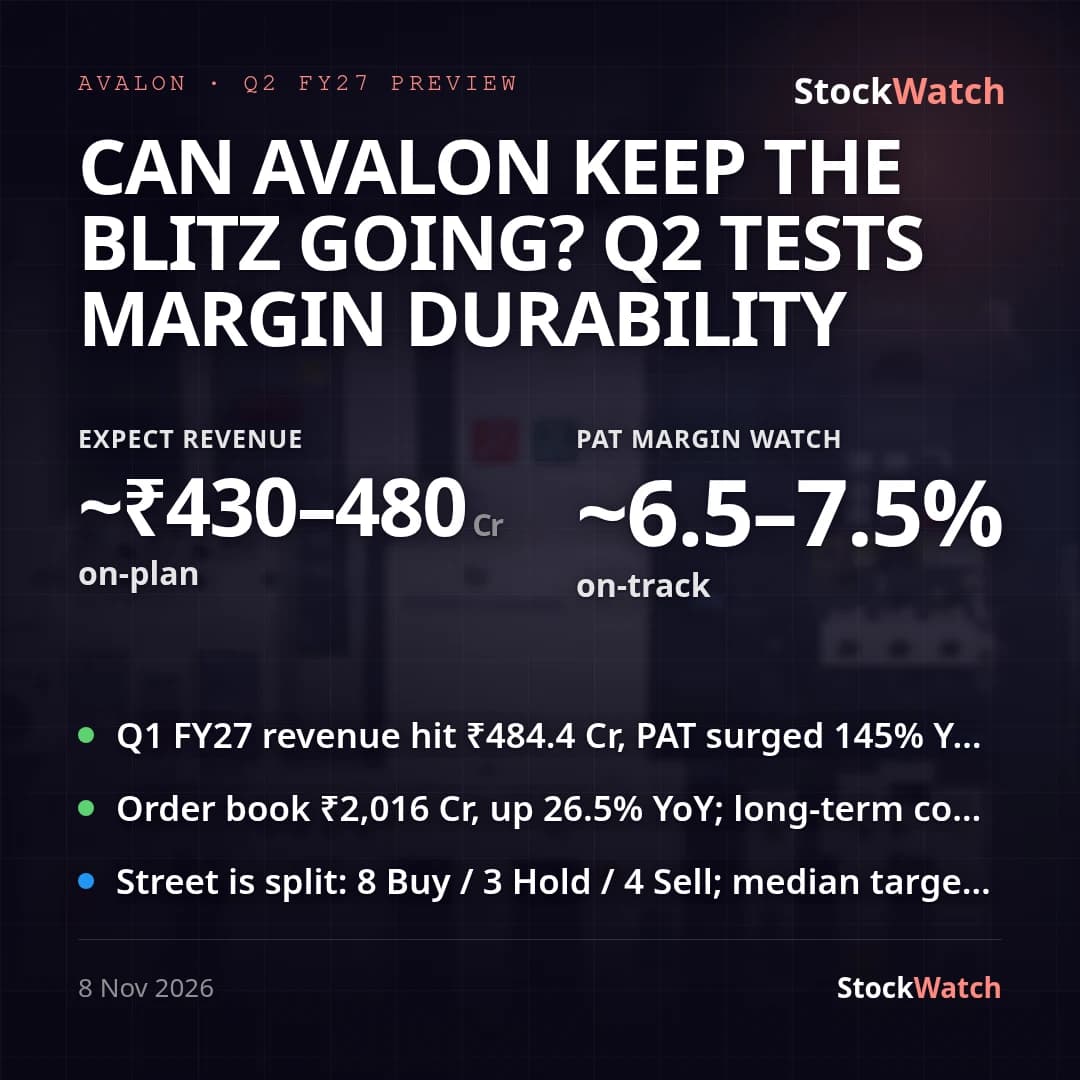 AVALONResult preview9 Nov
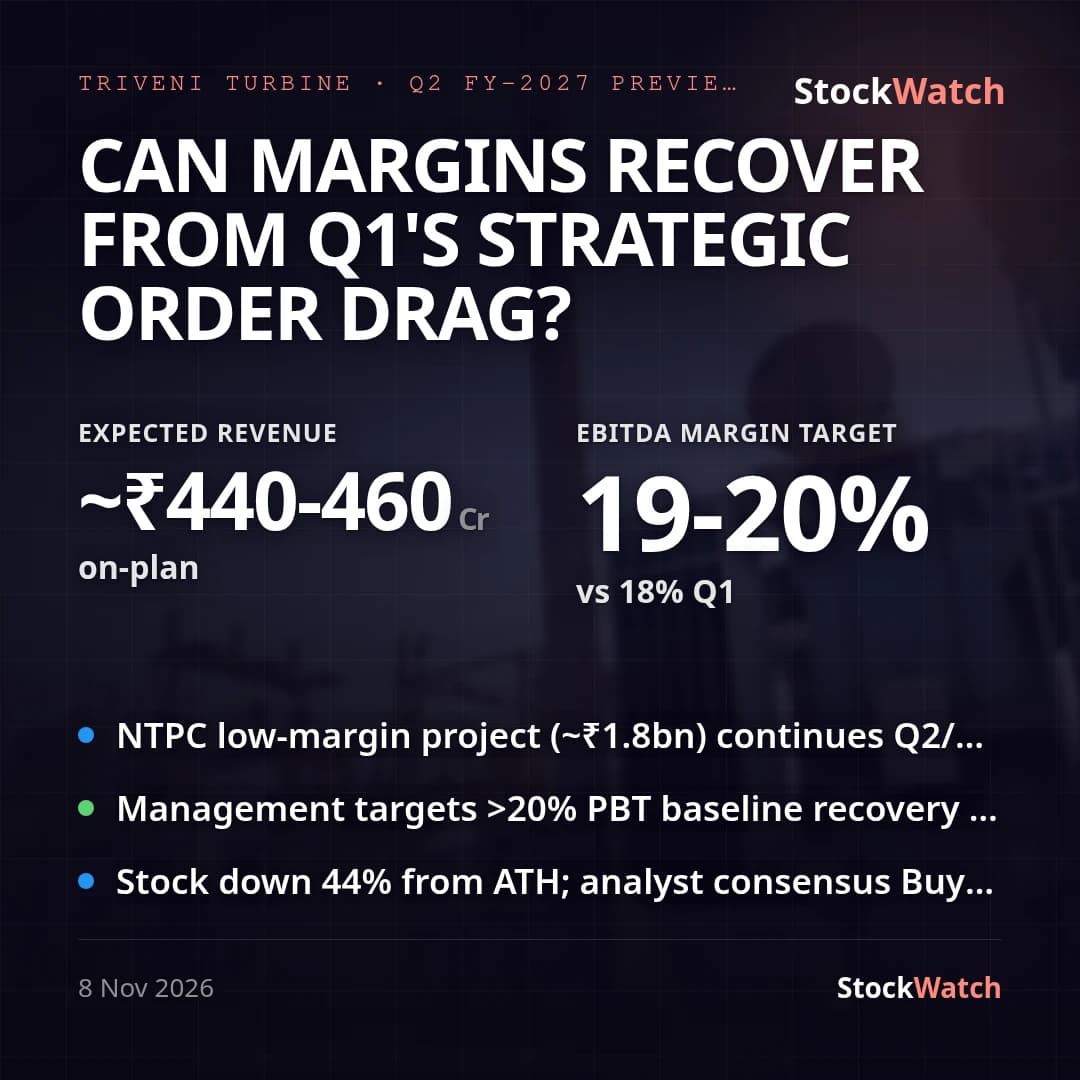 TRITURBINEResult preview9 Nov
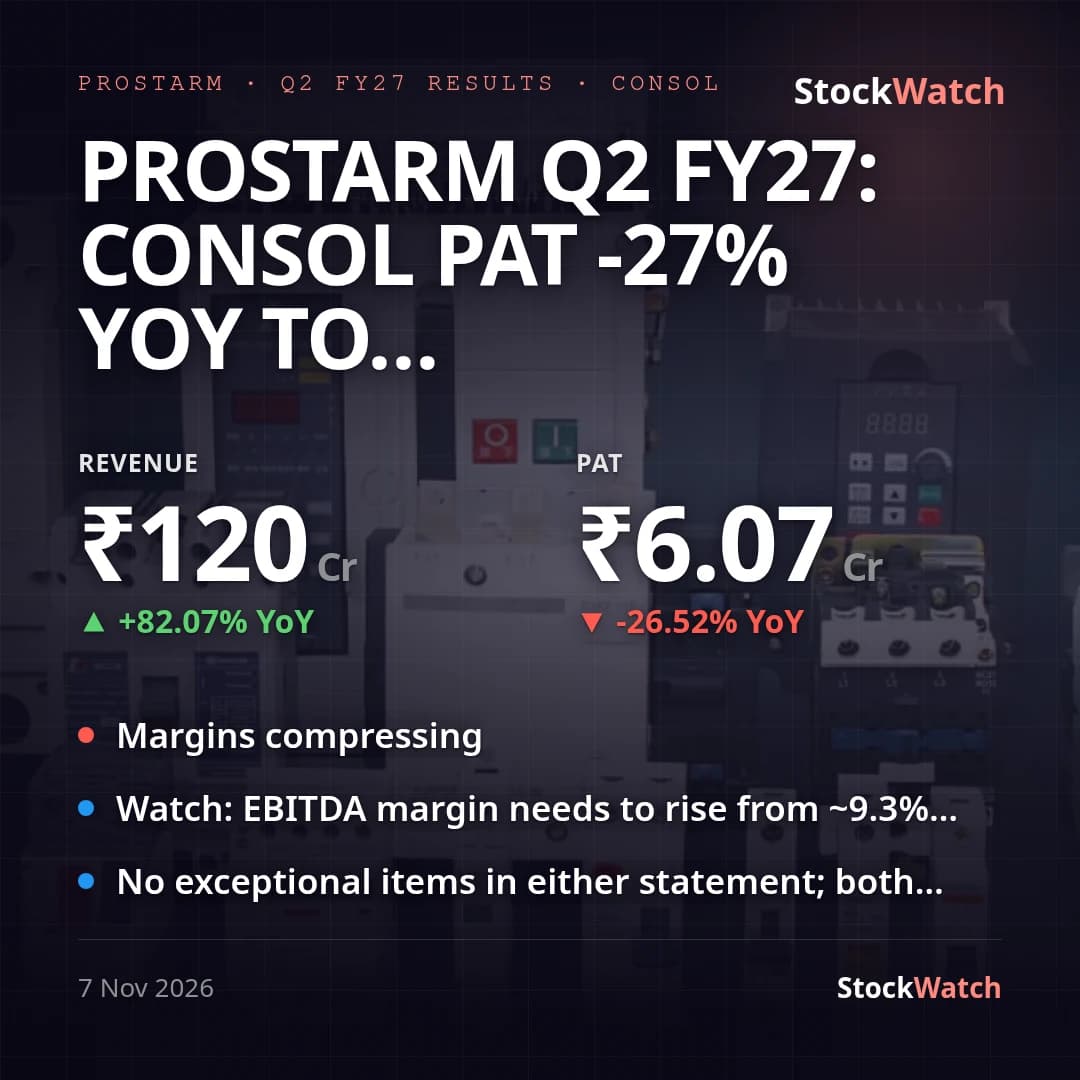 PROSTARMResults7 Nov
 SHRJAGPResults7 Nov
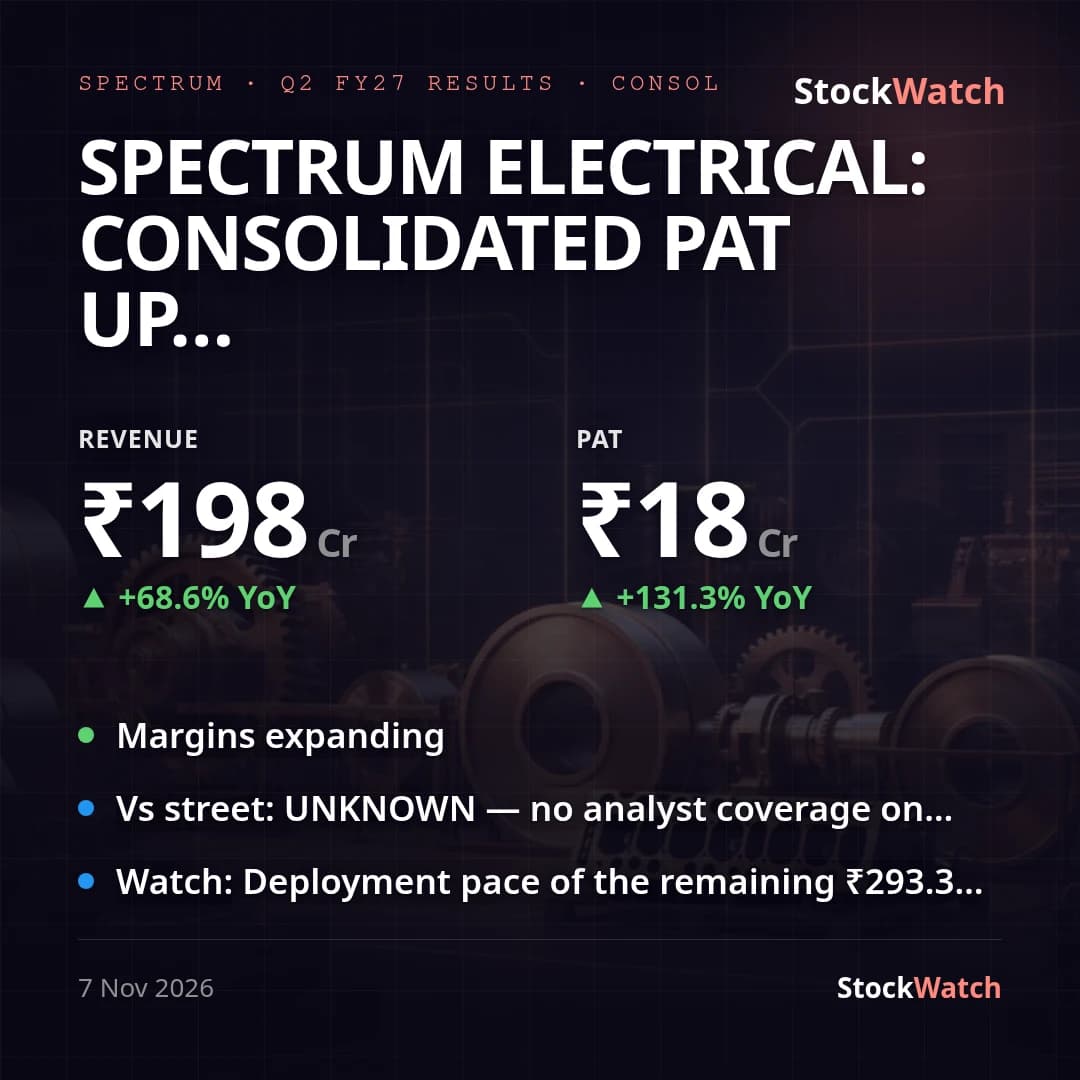 SPECTRUMResults7 Nov
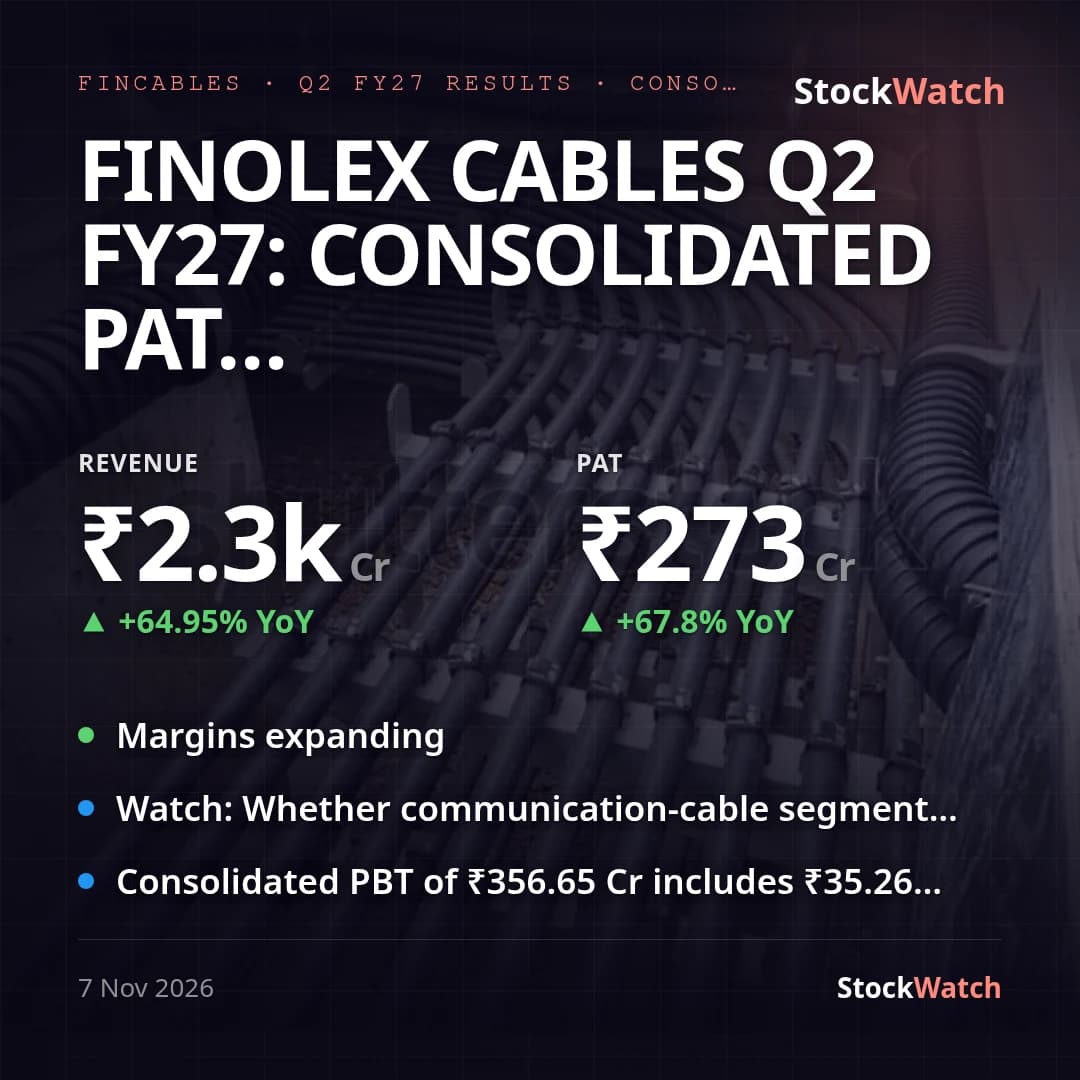 FINCABLESResults7 Nov
Reaction
Median day-1 move 0.4% · 168 up, 203 down of 386 priced
StockWatch Result Rating is our own rating of the reported quarter, not of the stock; counts are of quarters rated so far.
Results from companies below ₹100 Cr market cap are not rated, and a result is rated only once its final numbers are filed; "ratable" counts the results that qualify, plus any already rated.
Growth: year-on-year vs the same quarter of Q2 FY26, one basis per company (consolidated where both years report it, else standalone); banks, financial services and insurers by total income. Aggregate = growth of the summed values; median = the middle company. A company whose prior-year profit was a loss has no profit growth figure.
Day-1 reaction = the stock's move on the first session after the result, % vs the last close before it; medians are over quarters with a priced reaction.
Sectors are the 13 StockWatch groups; 241 quarters (diversified or unclassified companies) count in the totals but in no sector.
Size bands by market-cap rank across all listed companies we track: large = top 100, mid = 101-250, small = the rest.
Median vs trimmed median (S-3): `median` includes every company. `trimmedMedian` drops companies whose growth exceeds ±1000% — a fixed threshold, not a percentile of the tails — because a prior-year revenue near zero reads as six figures of growth (one company went 0.05 to 828, i.e. +1,586,107%). `extremes` counts what was dropped. Below 5 companies after the trim, `trimmedMedian` is null rather than naming one or two firms a median.
Updated 10 Nov 2026, 02:55 pm