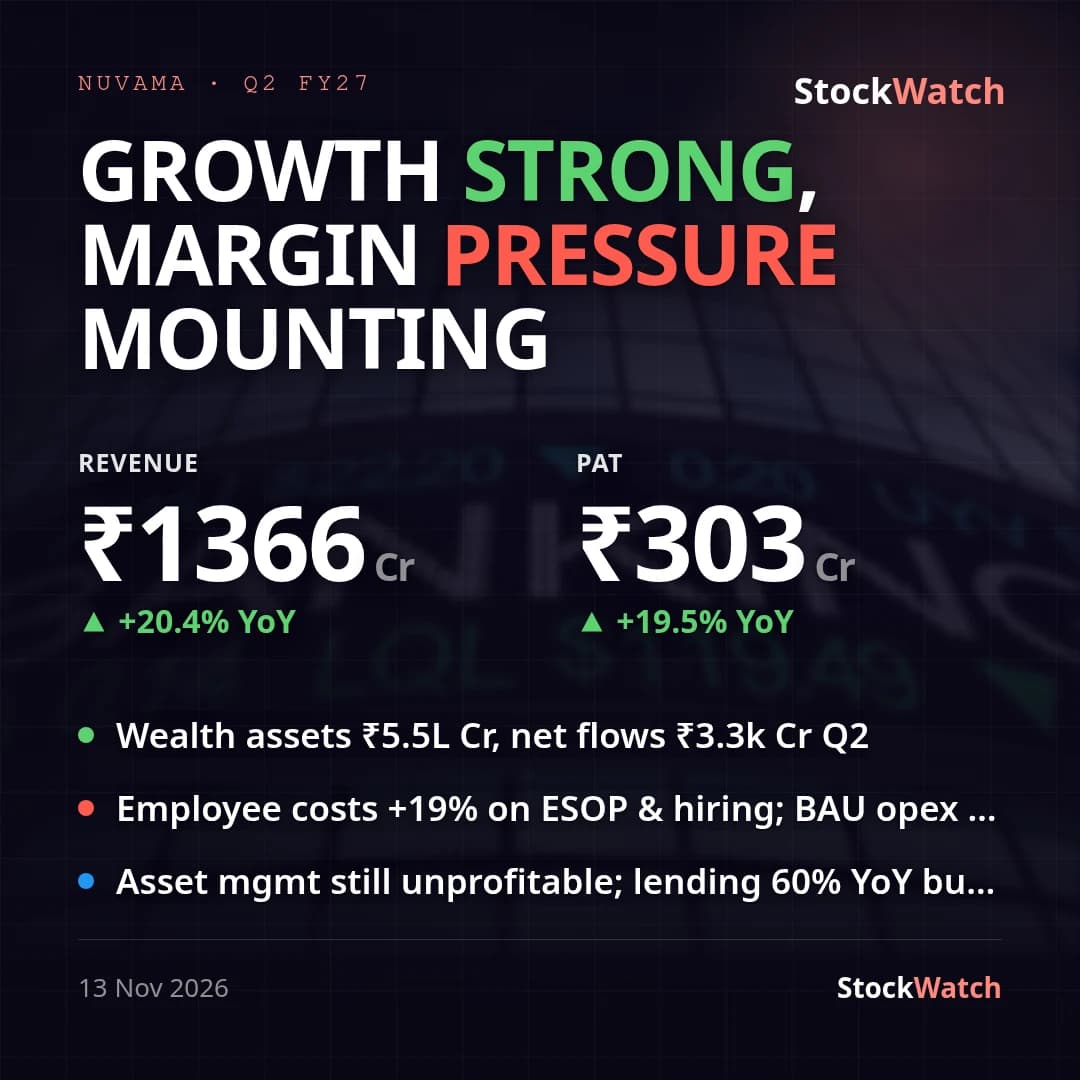
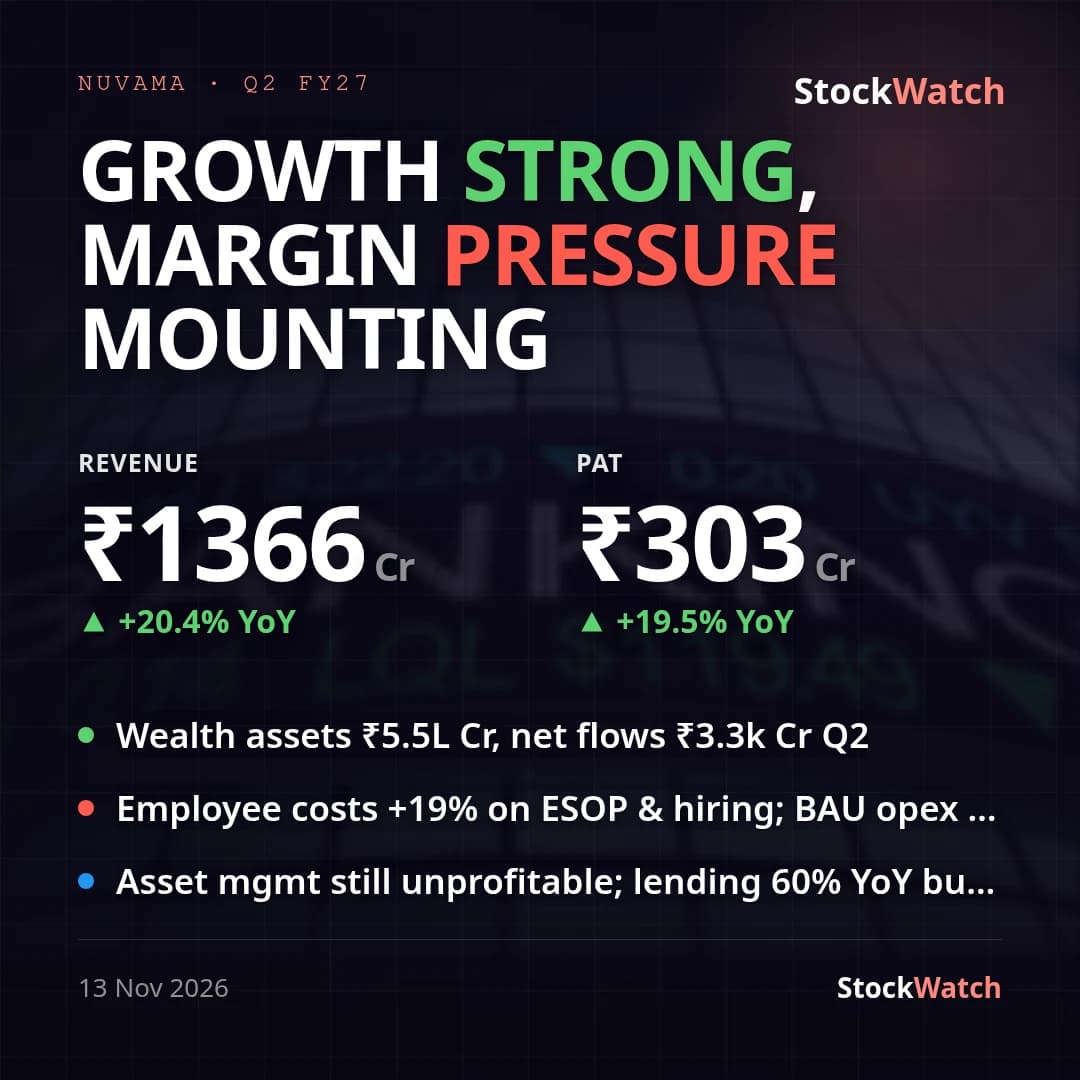
Nuvama Q2 FY27: consolidated PAT +19% YoY to ₹303 Cr, +26% adjusted for one-off charge
Nuvama Wealth Management's consolidated Q2 FY27 (quarter ended September 30, 2026) revenue from operations came in at ₹1,366.06 Cr, up 20.4% YoY but flat sequentially (-0.6% QoQ) from ₹1,374.88 Cr in Q1 FY27. Consolidated PAT was ₹303.48 Cr, up 19.5% YoY (down 0.7% QoQ from ₹305.64 Cr), with basic EPS of ₹16.54 (not annualised). Net profit margin held broadly flat at 22.2% versus 22.3% a year ago. Standalone PAT was ₹19.71 Cr on revenue of ₹201.78 Cr — this is the holding company's investment/advisory income only; the operating businesses sit in subsidiaries, so consolidated is the relevant basis for the group's performance and the two numbers are not meant to track each other.
The reported PAT print understates underlying growth: the quarter absorbed a one-time ₹16 Cr charge tied to the pre-closure of a Venture Debt Fund in the Asset Management business. Excluding this, the company's own 'Operating PAT' metric rose 26% YoY to ₹319 Cr (from ₹254 Cr), with RoE around 29% per management. The charge shows up directly in segment results — Asset Management's segment loss before tax widened to ₹34.1 Cr in Q2 from ₹7.7 Cr in Q1, taking the H1 cumulative segment loss to ₹41.8 Cr. That already exceeds management's own full-year guided peak loss of ₹35-40 Cr for the Asset Management business at just the half-year mark — a miss on that specific guidance line even as the rest of the group tracks or beats its targets. Wealth Management segment PBT grew 22% YoY to ₹184 Cr and Asset Services & Capital Markets PBT grew 34% YoY to ₹259 Cr, together more than offsetting the Asset Management drag.
Flow and growth metrics ran ahead of guidance elsewhere: Asset Services revenue grew 53% YoY in Q2 (43% YoY in H1), well above management's 20-25% FY27 growth guidance for that business. Wealth (MPIS) net flows hit a record ₹3,289 Cr in the quarter and Private (ARR) net flows a record ₹4,986 Cr, taking H1 combined wealth-and-private flows to roughly ₹12,400 Cr against the company's FY27 target band of ₹20,000-24,000 Cr — tracking the target if H2's typically stronger run-rate holds. Cost-to-income on the company's own net-revenue basis was about 54% (₹507 Cr costs on ₹937 Cr net revenues), in line with the 55% consolidated guidance management gave on the Q1 FY27 call. The same day as results, the Board approved up to ₹700 Cr of fresh investment into two wholly-owned subsidiaries (₹400 Cr into Nuvama Wealth Finance, ₹300 Cr into Nuvama Wealth and Investment), funding further balance-sheet scale-up in the NBFC and wealth-investment arms; client assets overall rose 25% YoY to ₹5.5 trillion, with MPIS/ARR assets up 27% YoY to nearly ₹1.1 trillion.
No verified third-party consensus estimate for this specific quarter's PAT could be sourced, so the print's performance versus Street is unknown; prior-quarter commentary had flagged Nuvama beating brokerage (MOFSL) estimates in Q1 FY27, but that read does not carry over without a fresh Q2 number. Management's own framing — CEO Ashish Kehair citing 'another quarter of strong performance' with operating profit growth of 26% YoY — lines up with the adjusted PAT figure once the one-off charge is excluded, though the as-reported 19.5% YoY PAT growth is the more conservative, statutory figure investors will also see quoted elsewhere.