


final · 40 of 40 results
40
of 40 results
78%
very good + good, of 40 rated
+30.7%
median YoY, n=37
+0.6%
median, n=40
Numbers
Profit up at 35 of 37 (94.6%) · growing faster than 15%: 29 (78.4%)
Reports
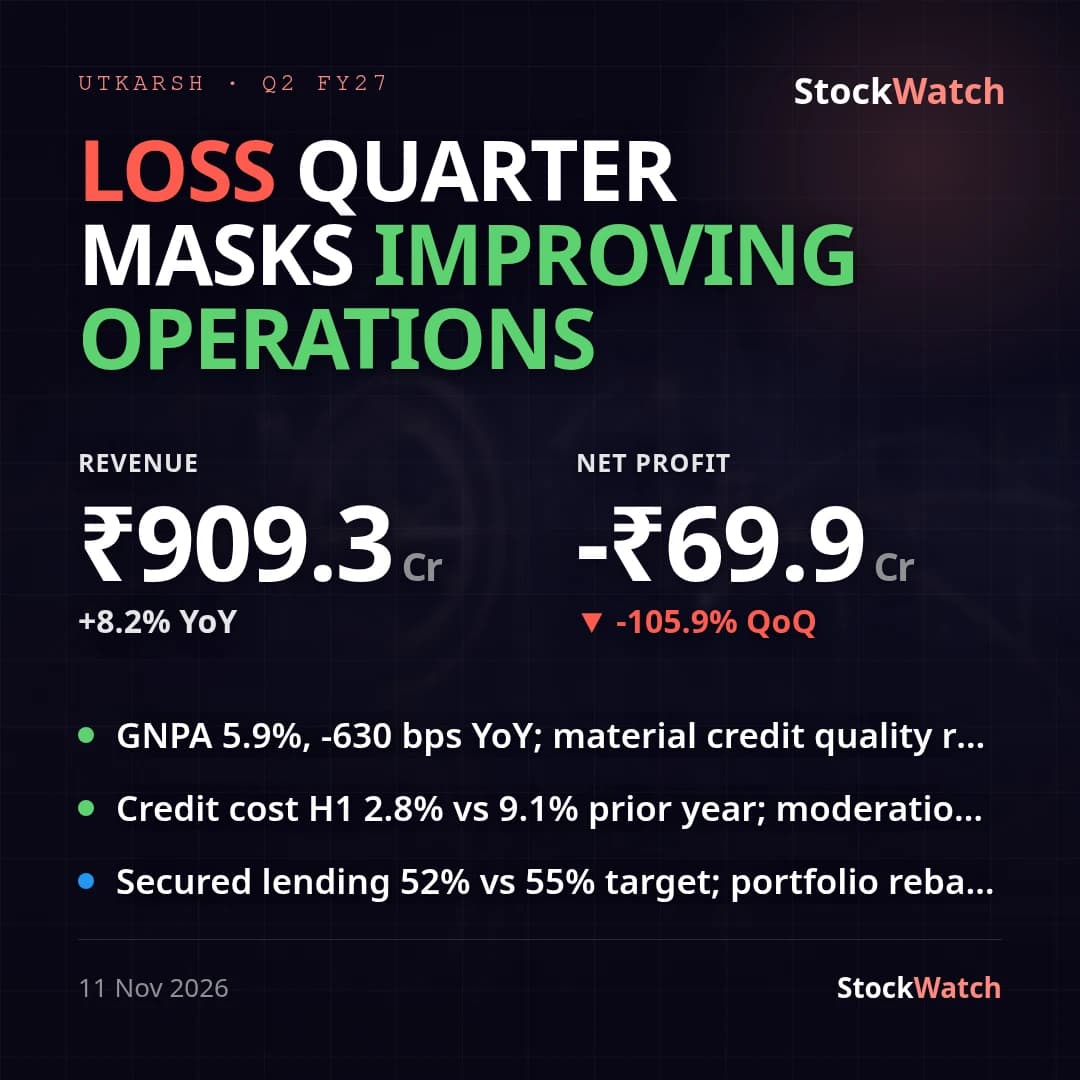 UTKARSHBNKResult verdict11 Nov
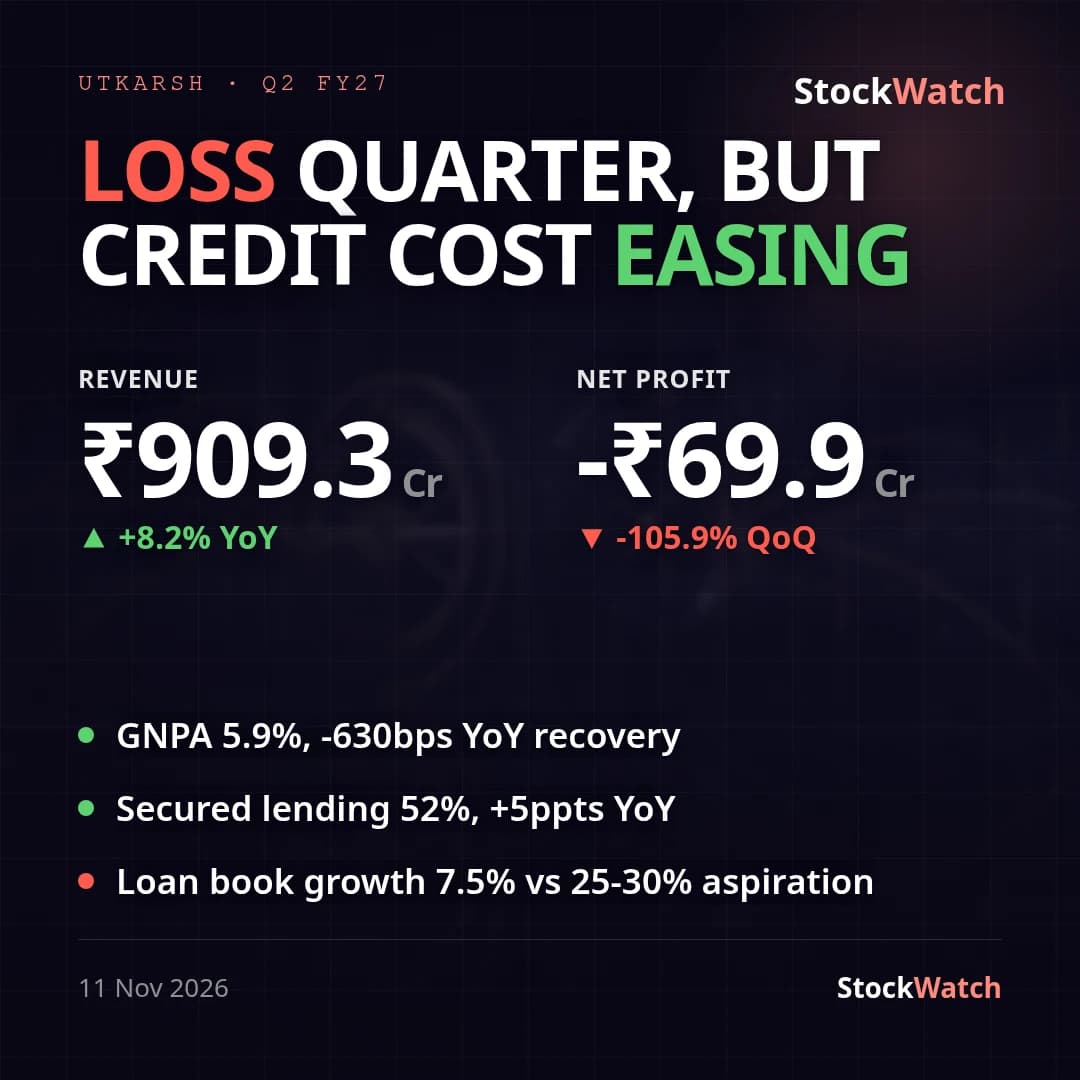 UTKARSHBNKTranscript11 Nov
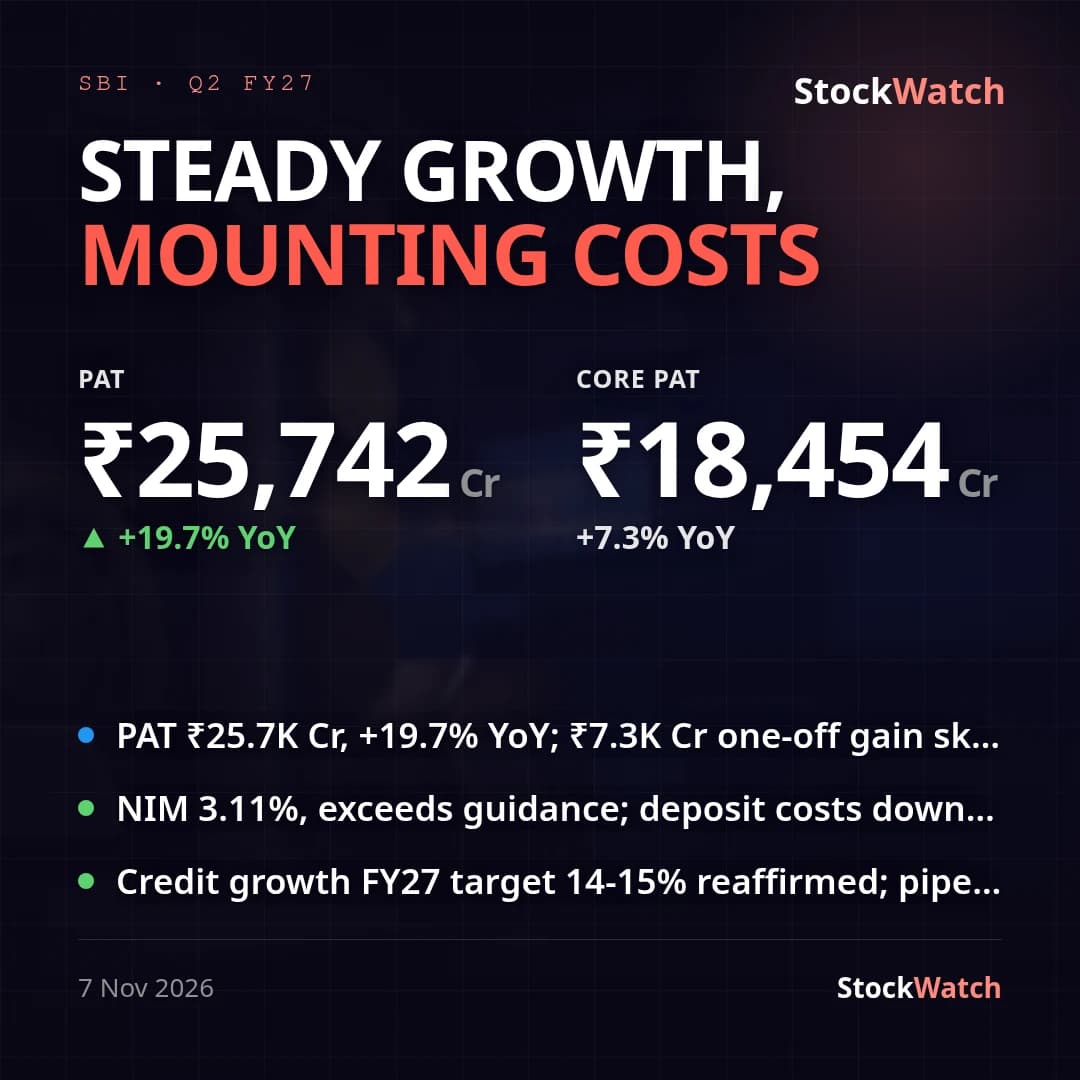 SBINResult verdict7 Nov
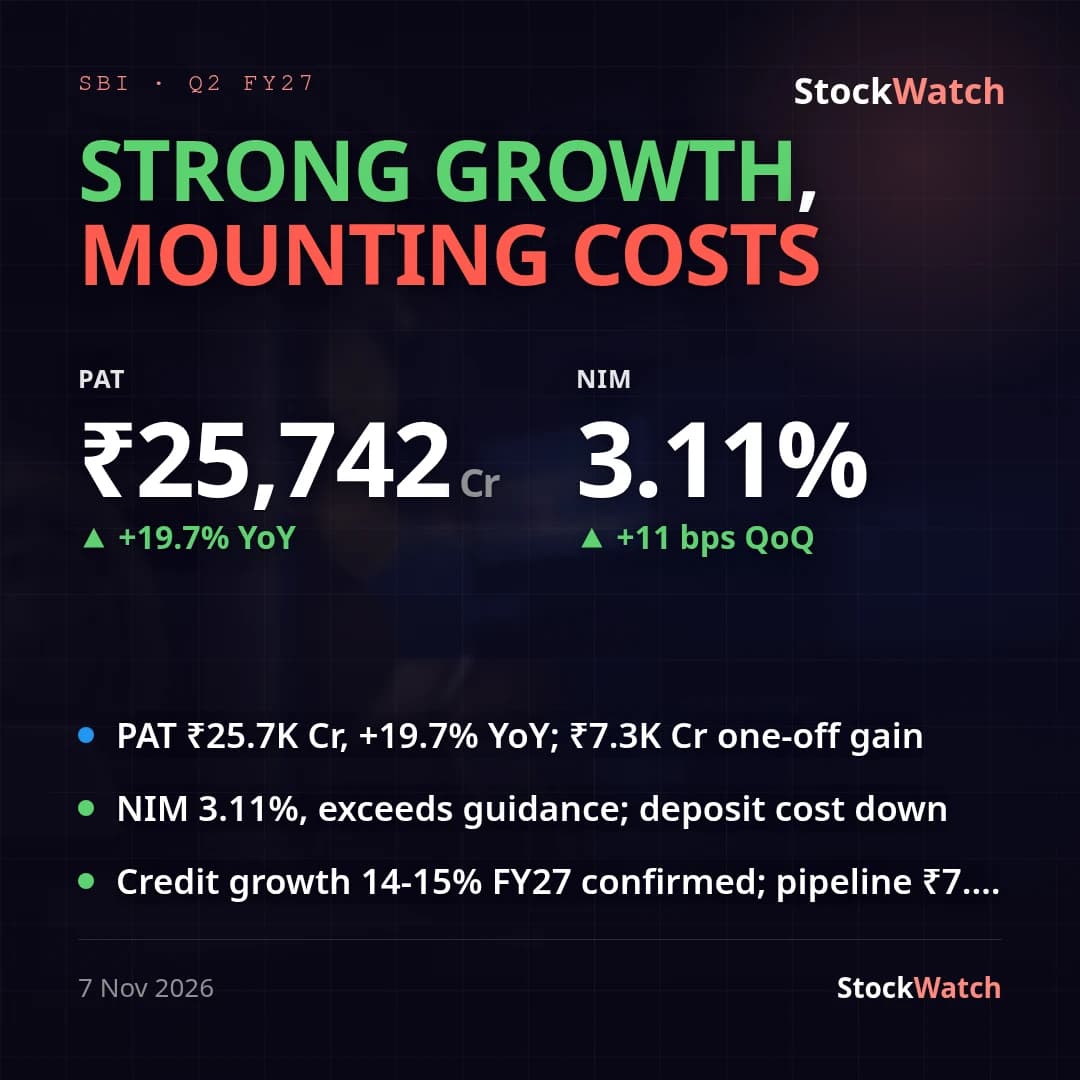 SBINTranscript7 Nov
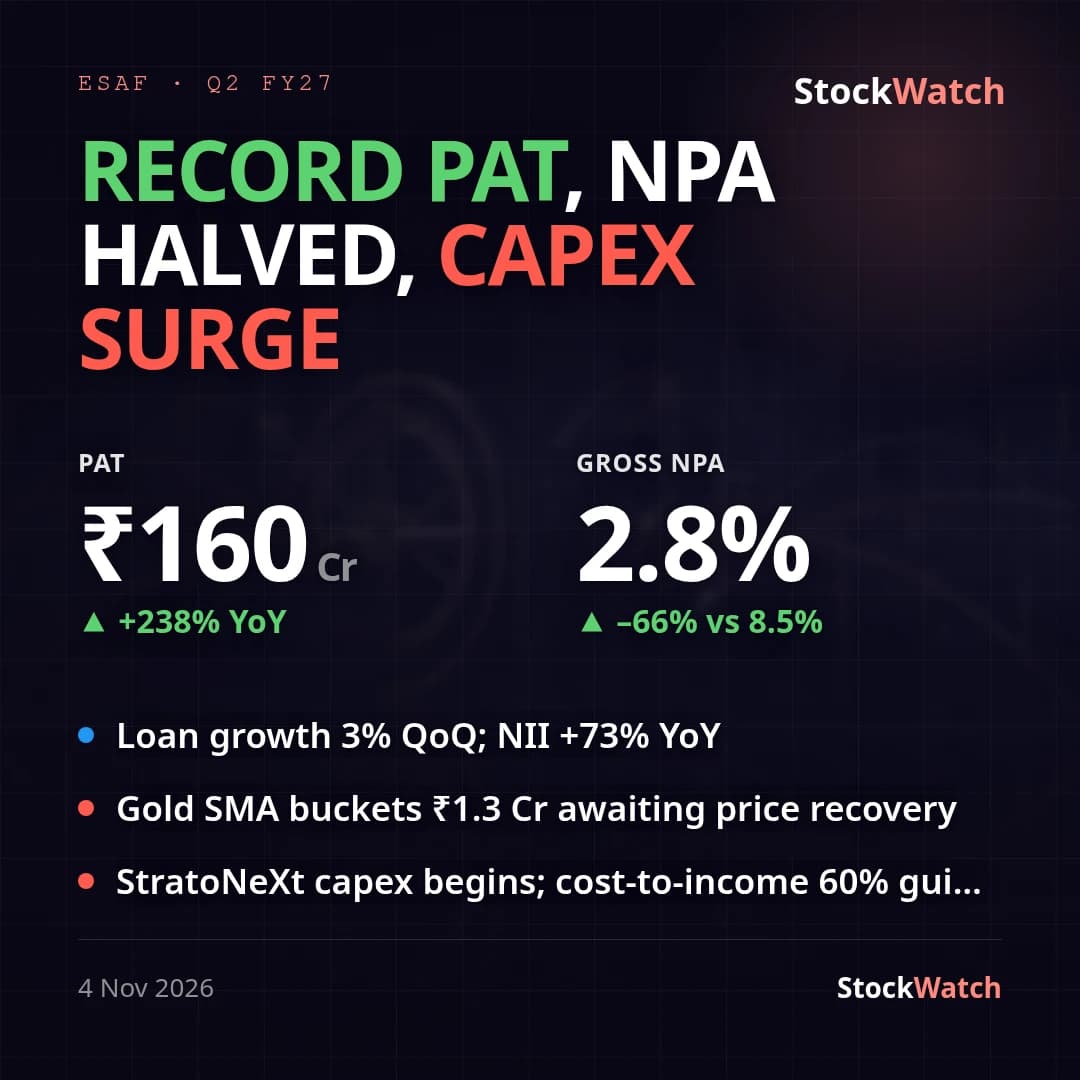 ESAFSFBResult verdict4 Nov
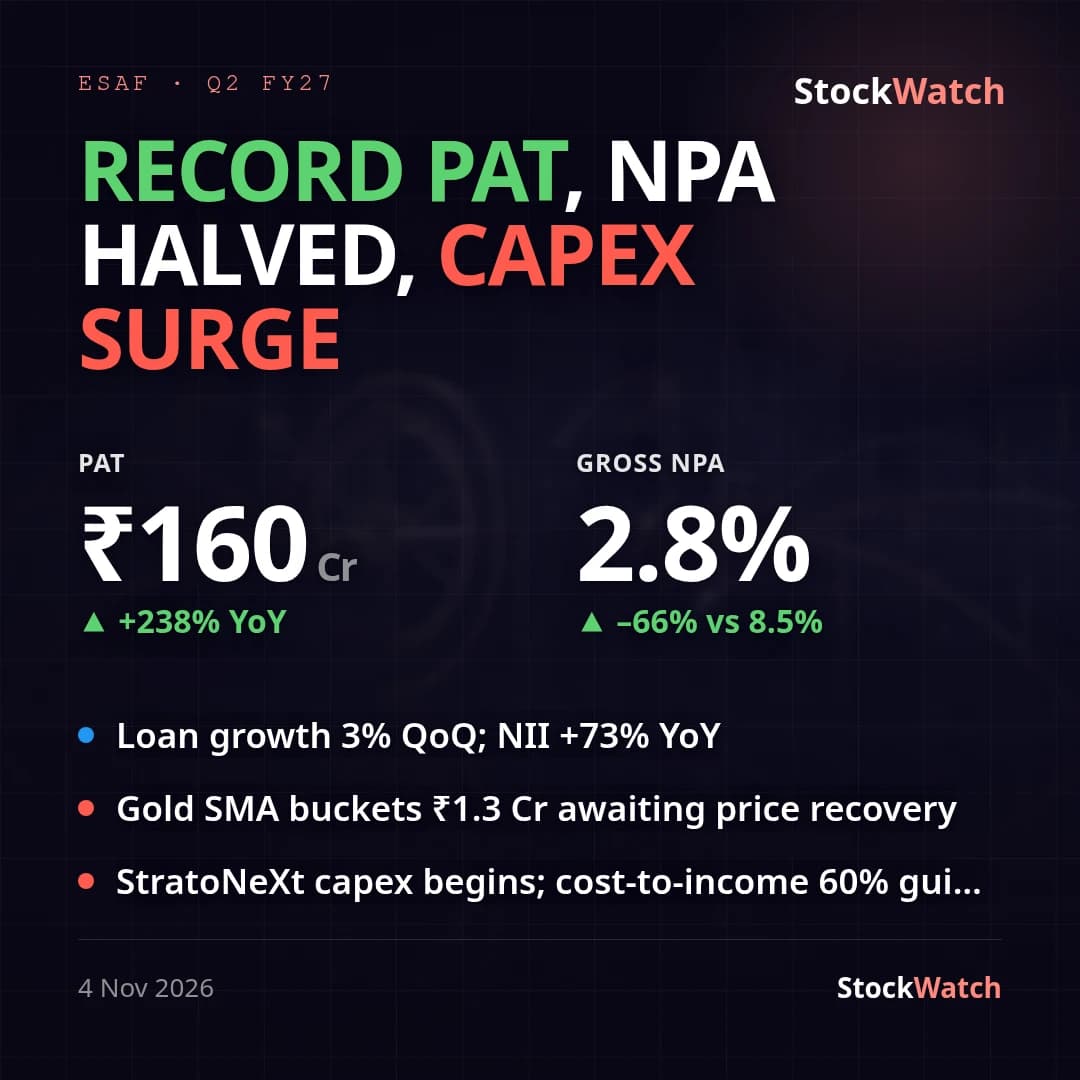 ESAFSFBTranscript4 Nov
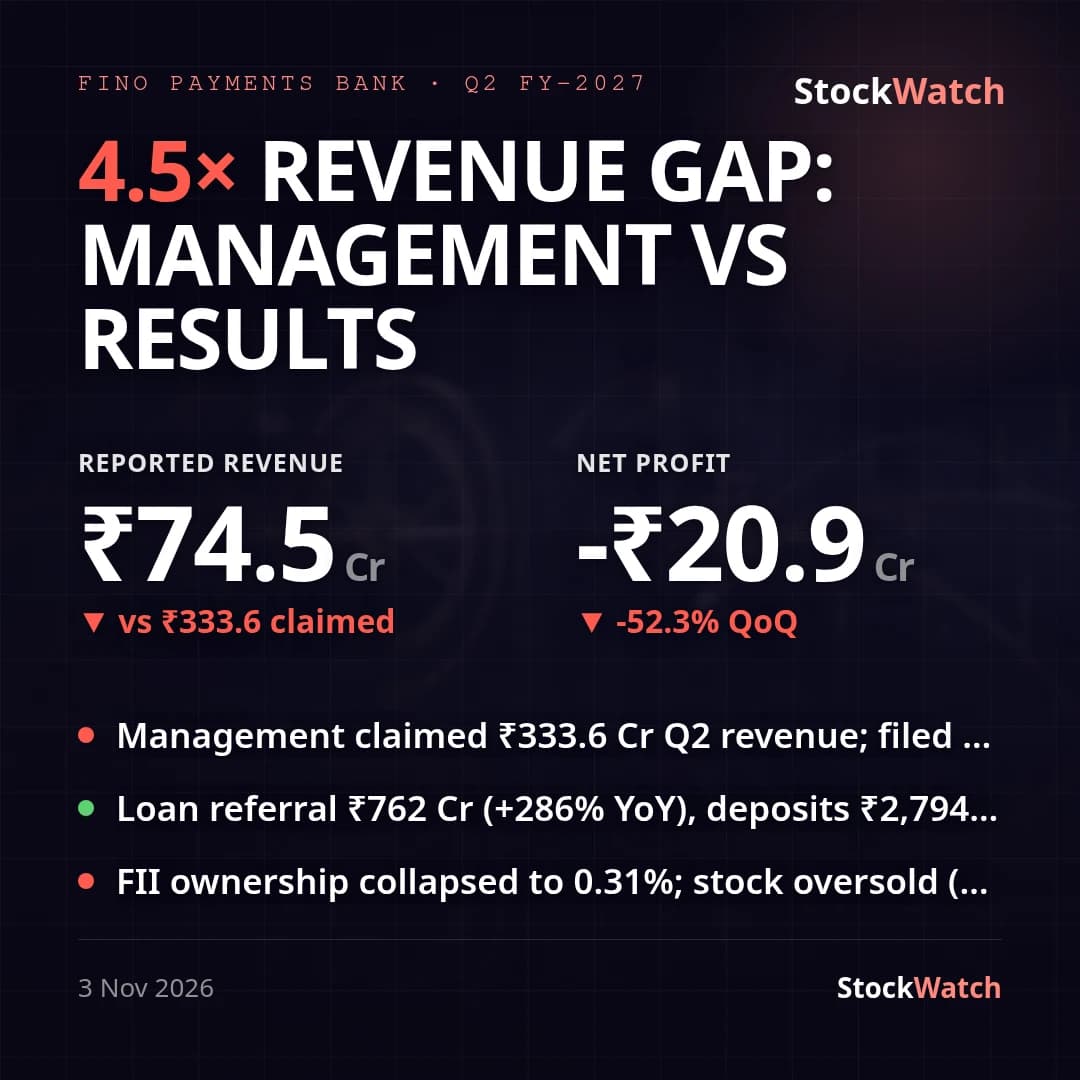 FINOPBResult verdict3 Nov
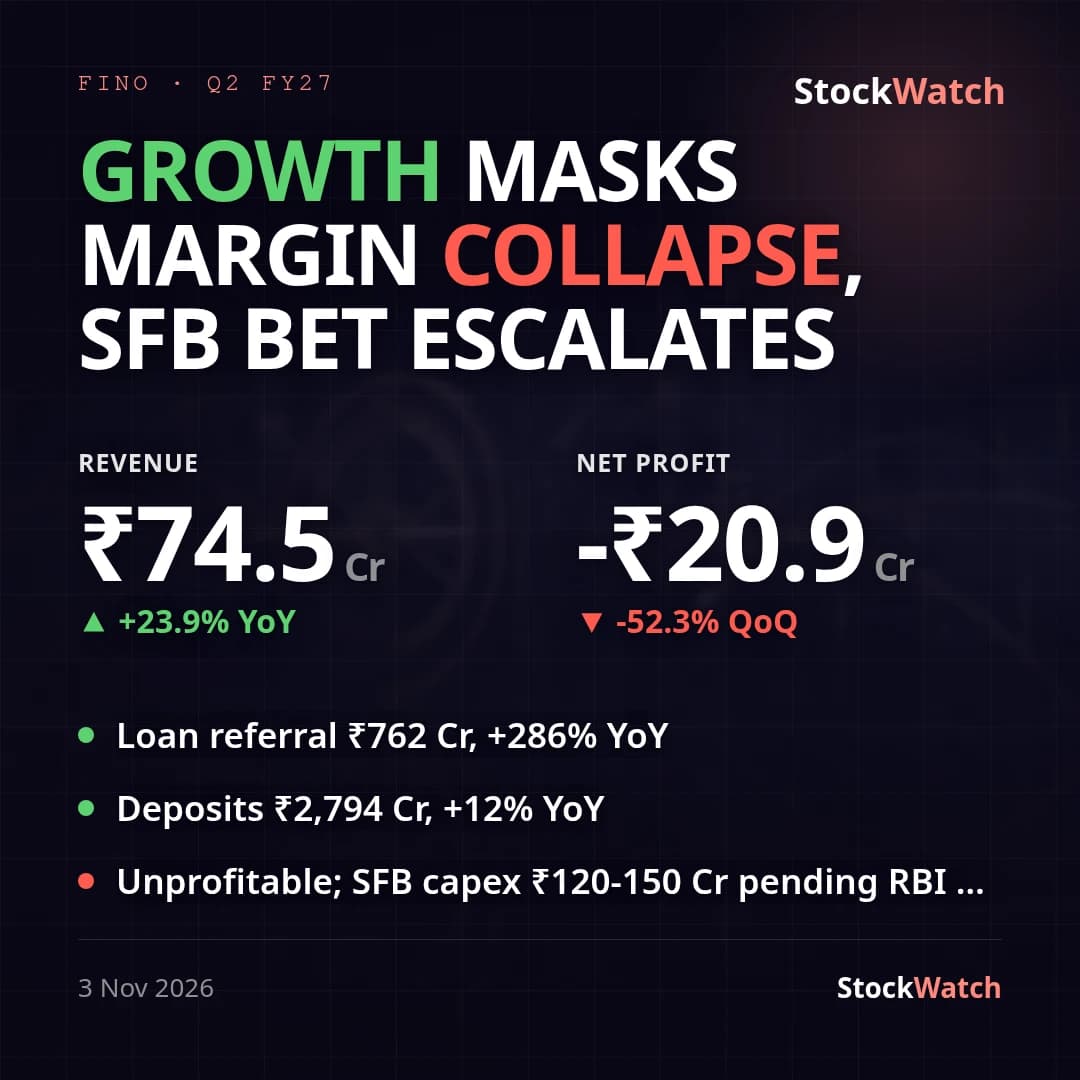 FINOPBTranscript3 Nov
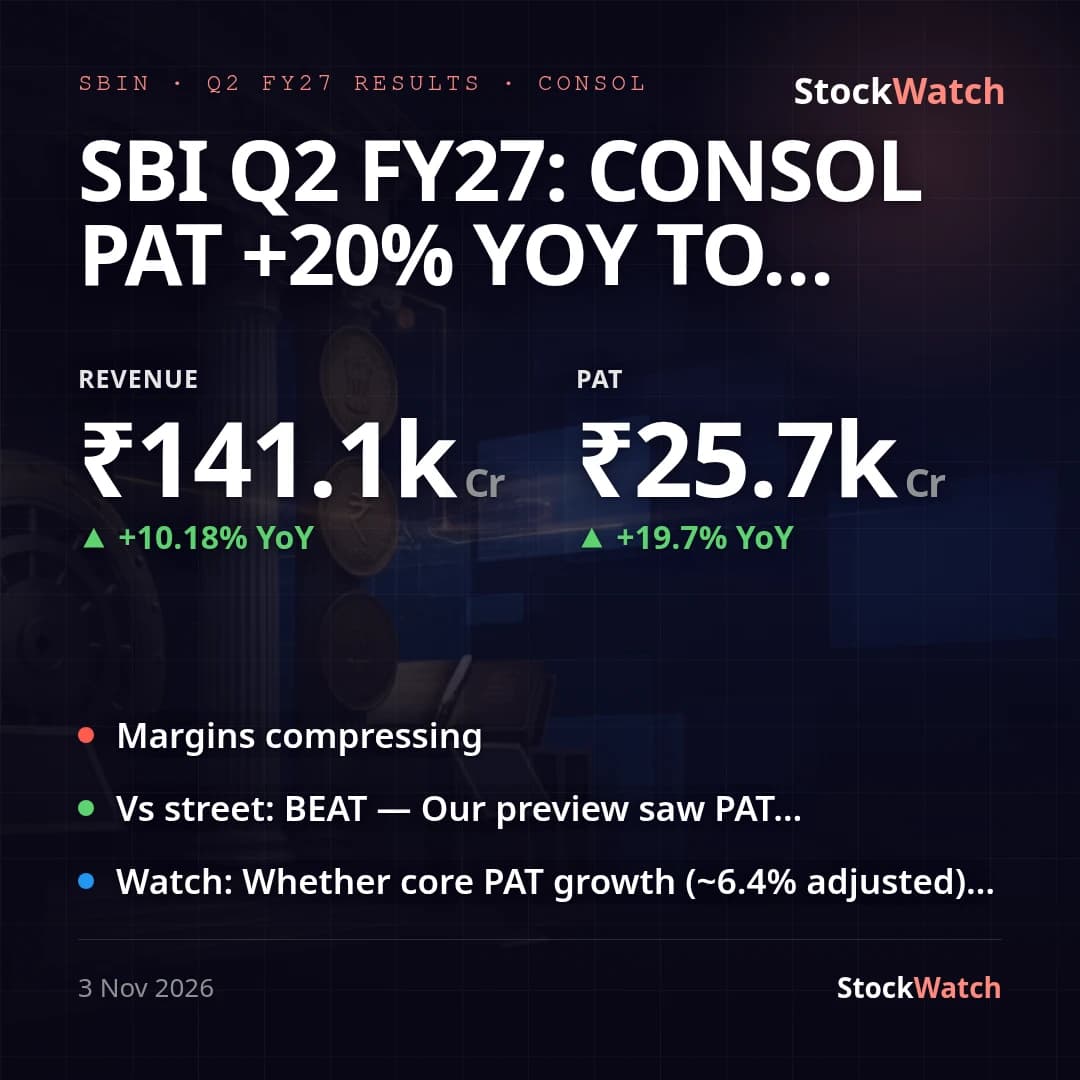 SBINResults3 Nov
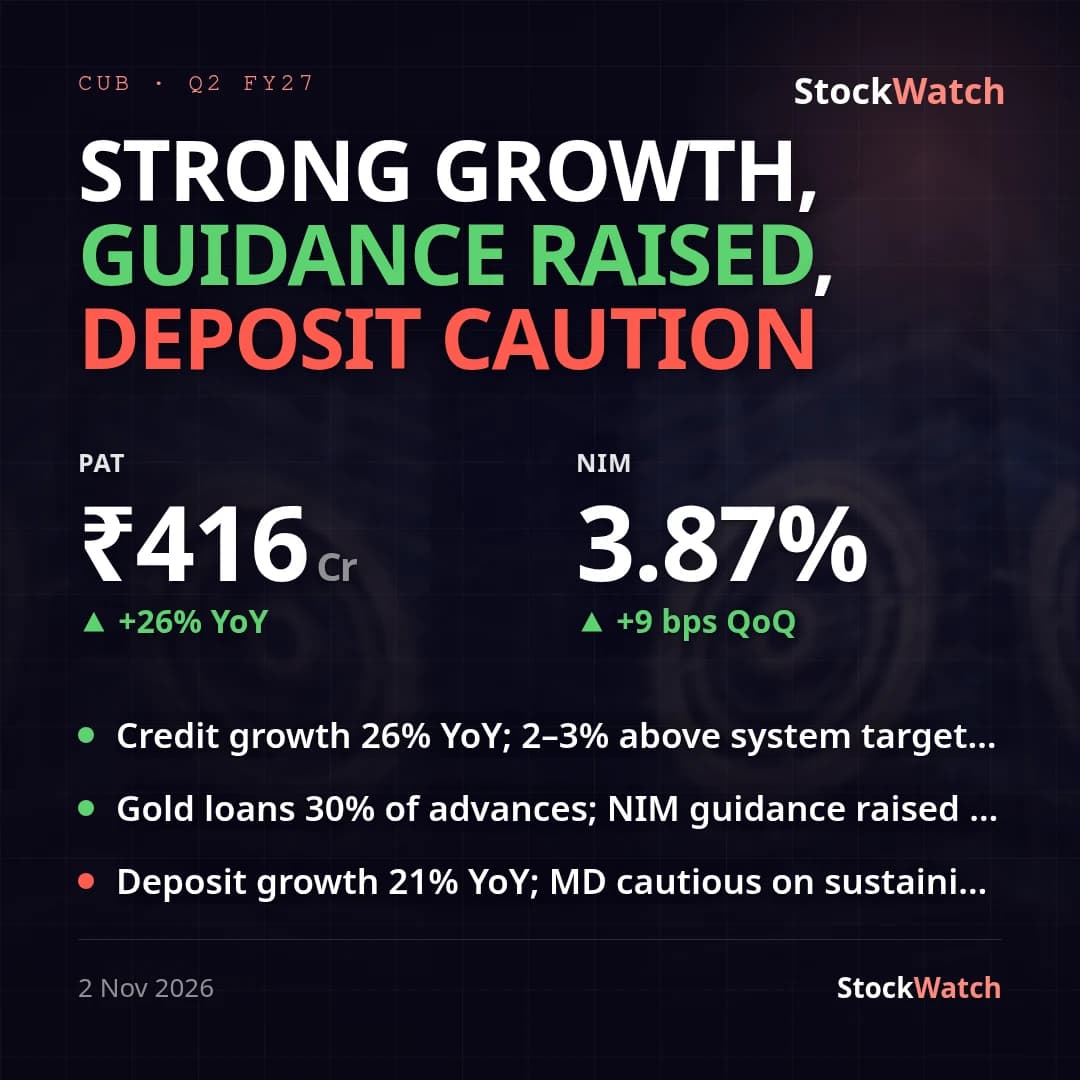 CUBResult verdict2 Nov
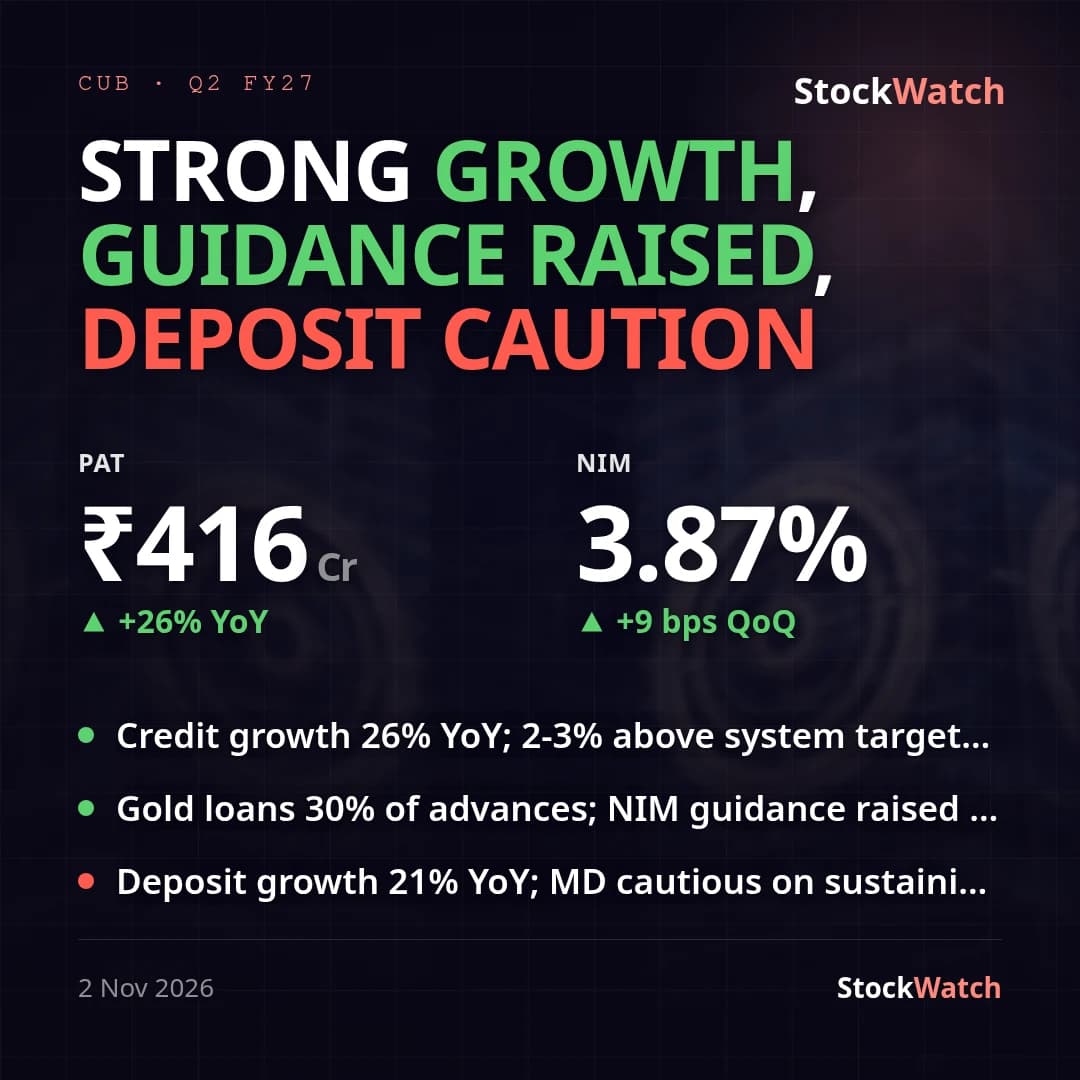 CUBTranscript2 Nov
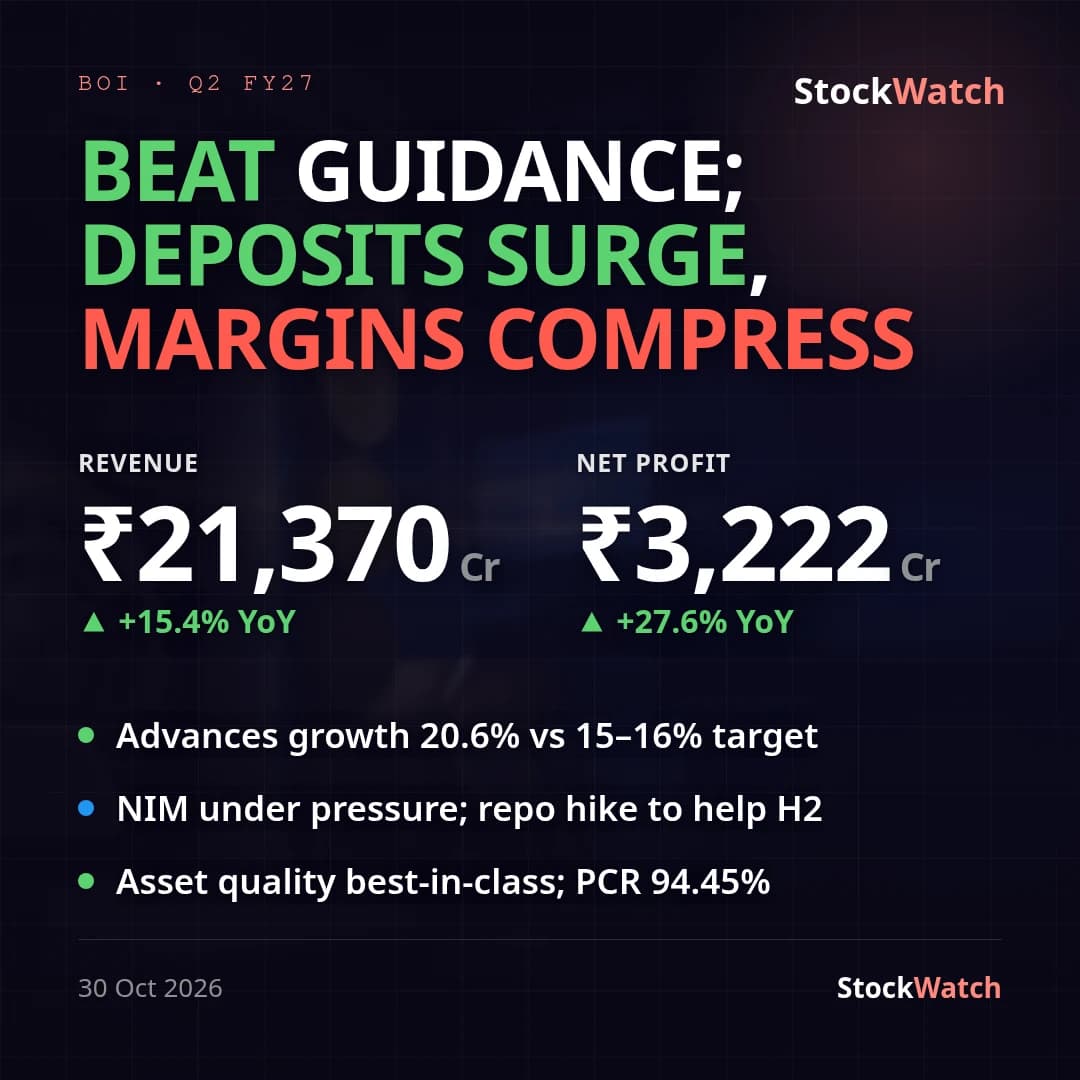 BANKINDIAResult verdict30 Oct
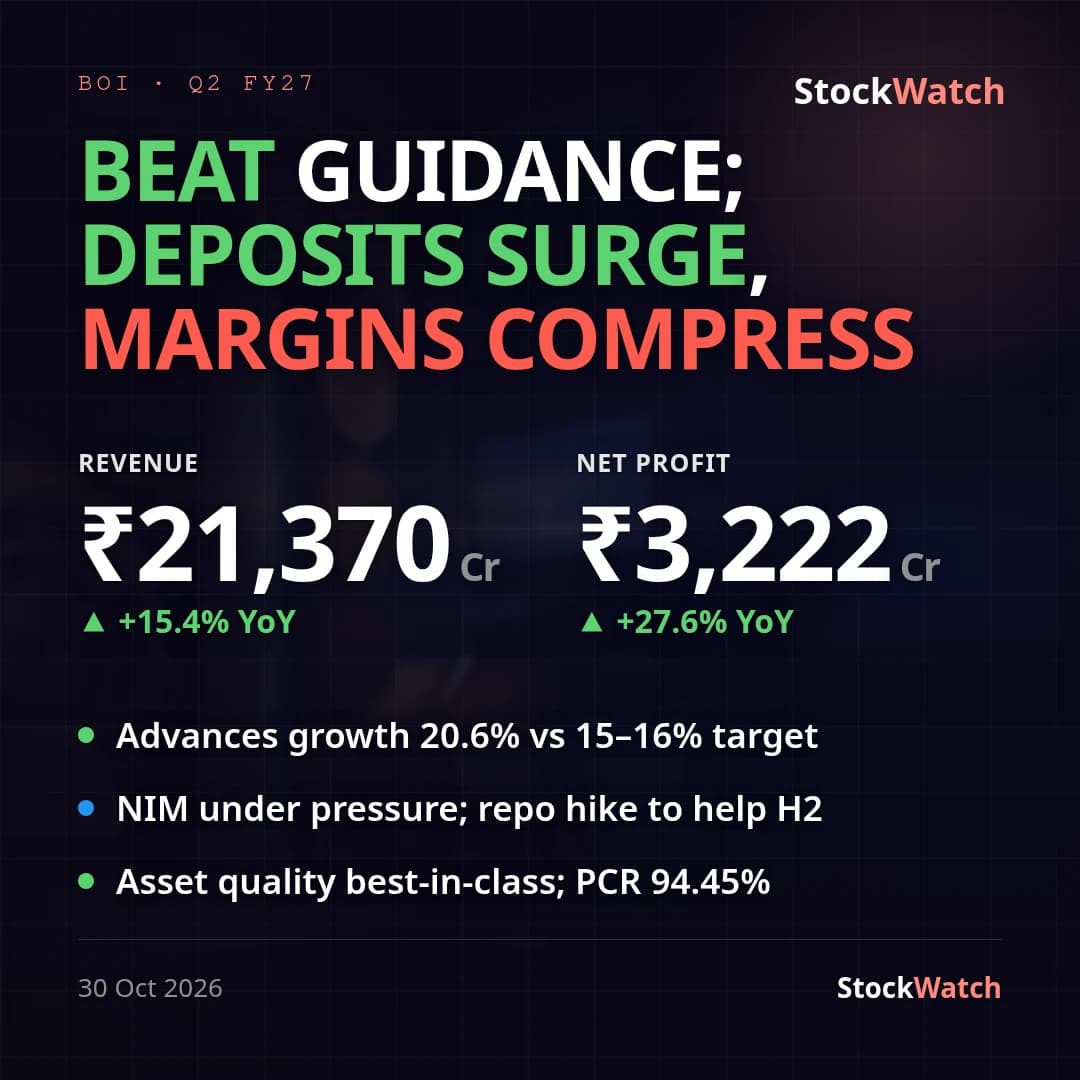 BANKINDIATranscript30 Oct
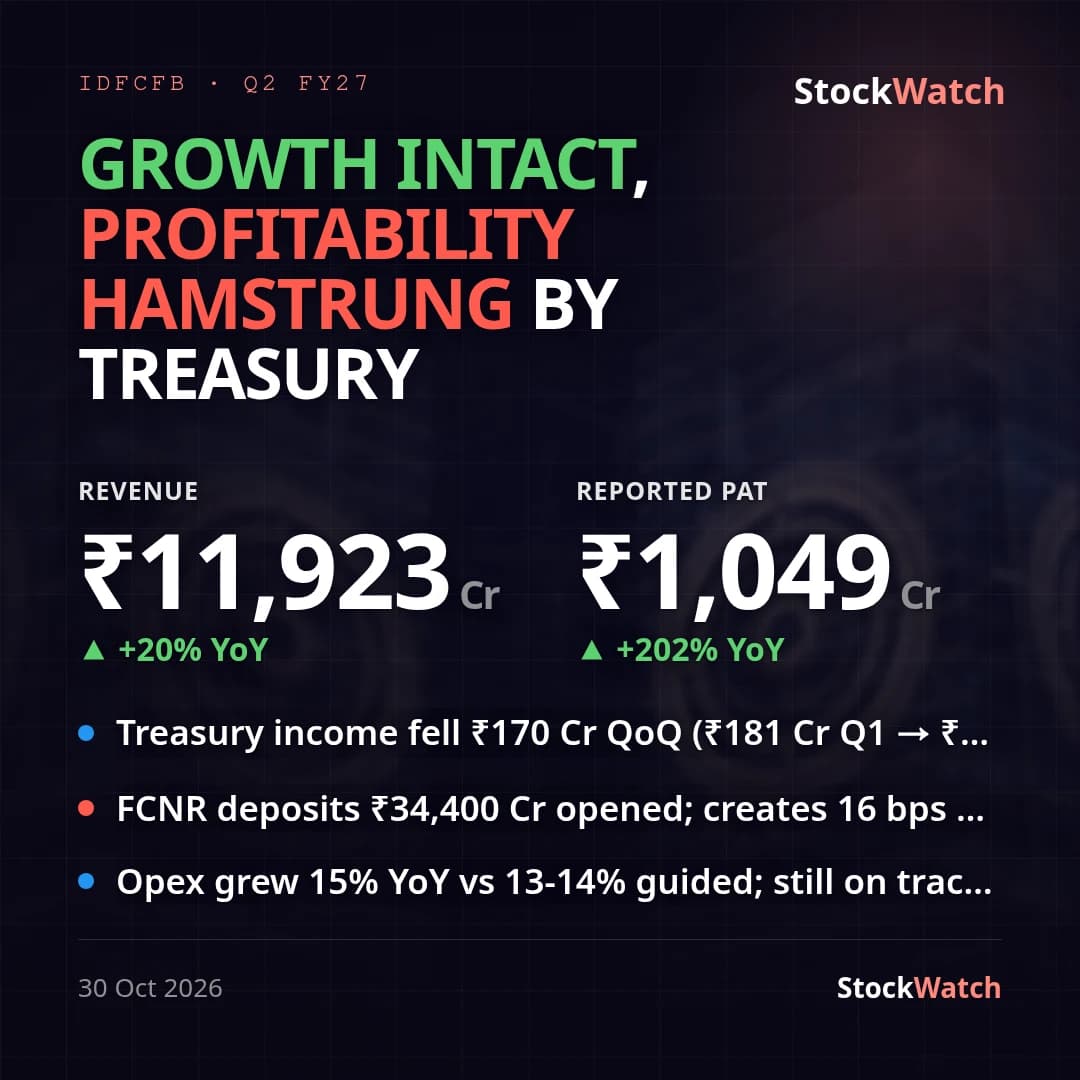 IDFCFIRSTBResult verdict30 Oct
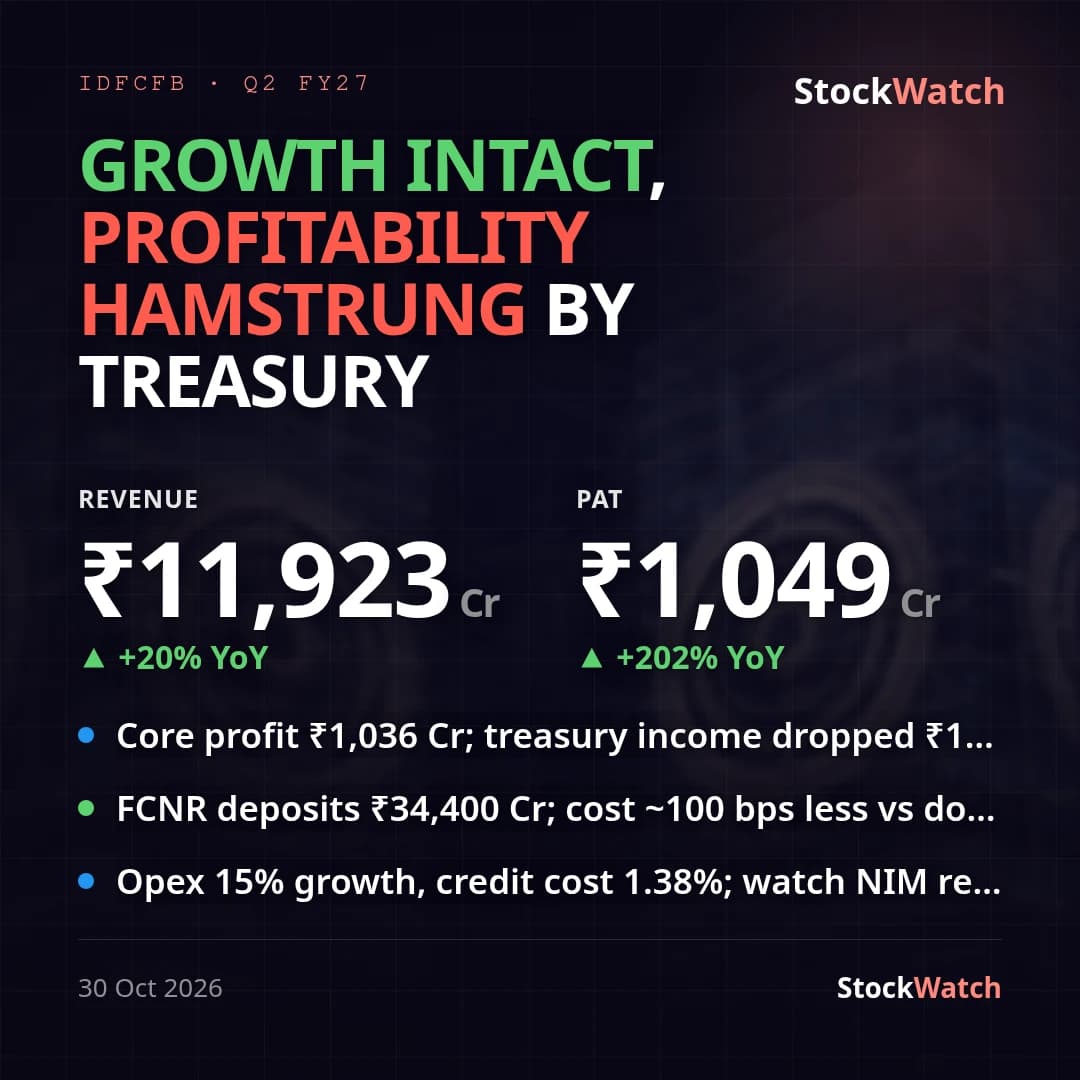 IDFCFIRSTBTranscript30 Oct
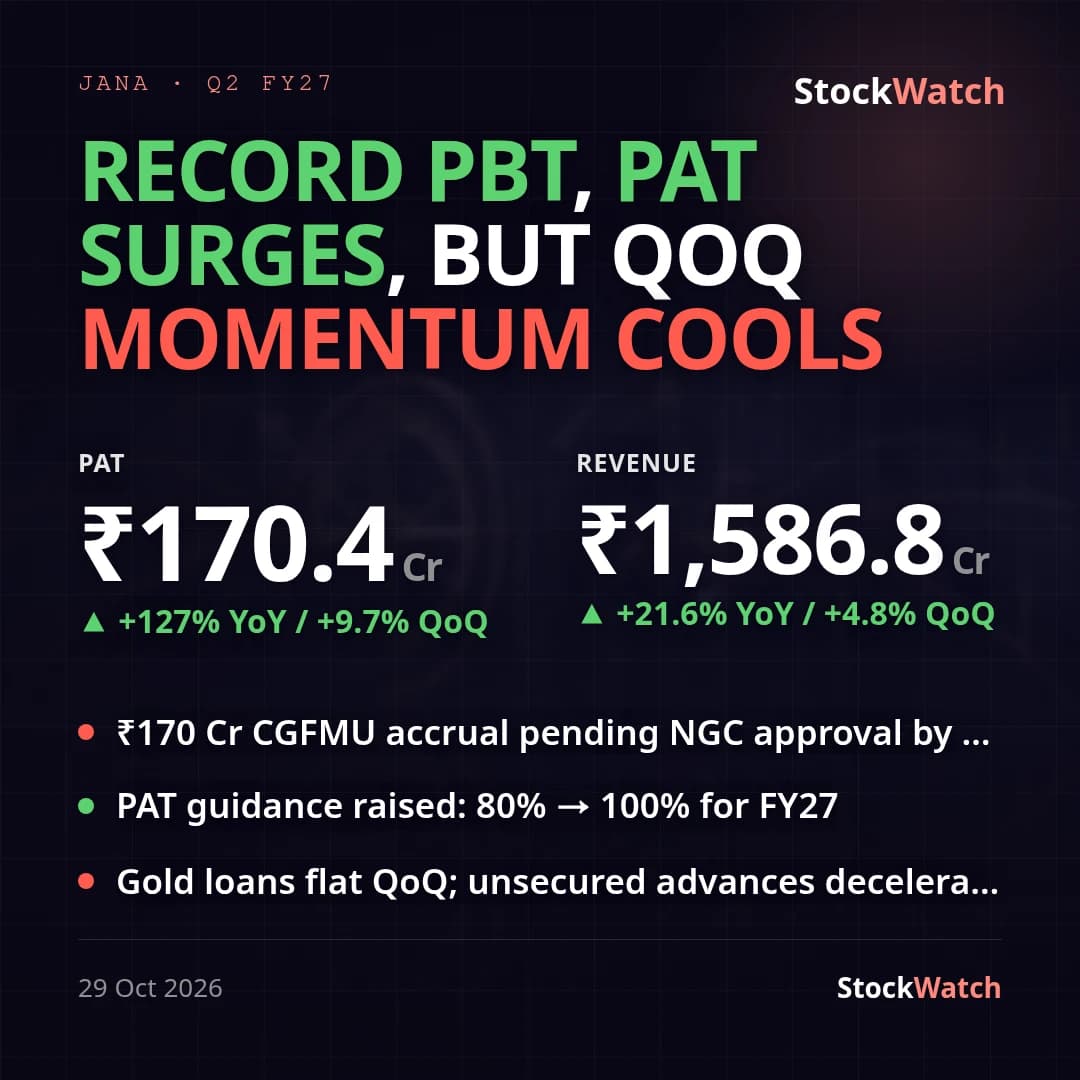 JSFBResult verdict29 Oct
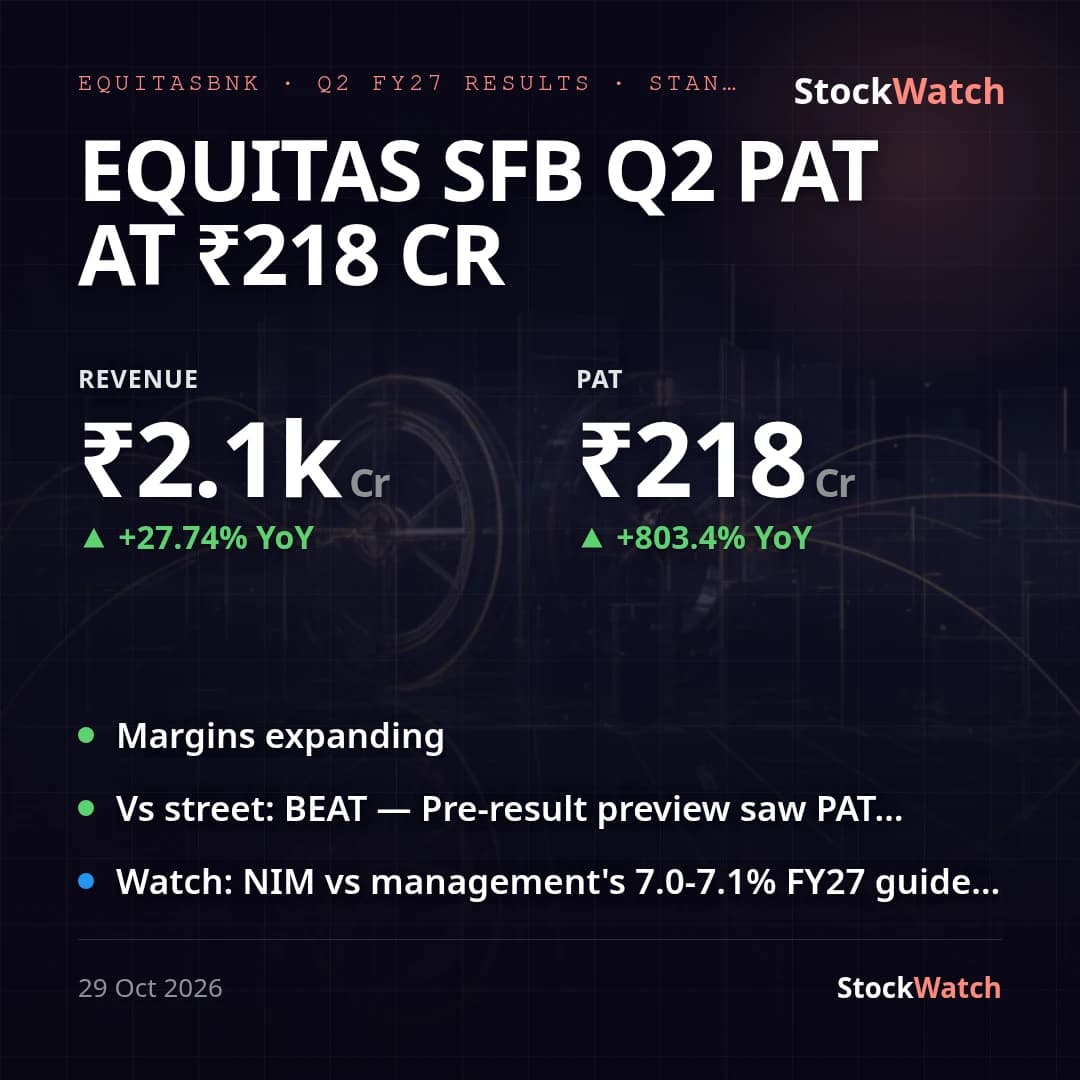 EQUITASBNKResults29 Oct
 ESAFSFBResults29 Oct
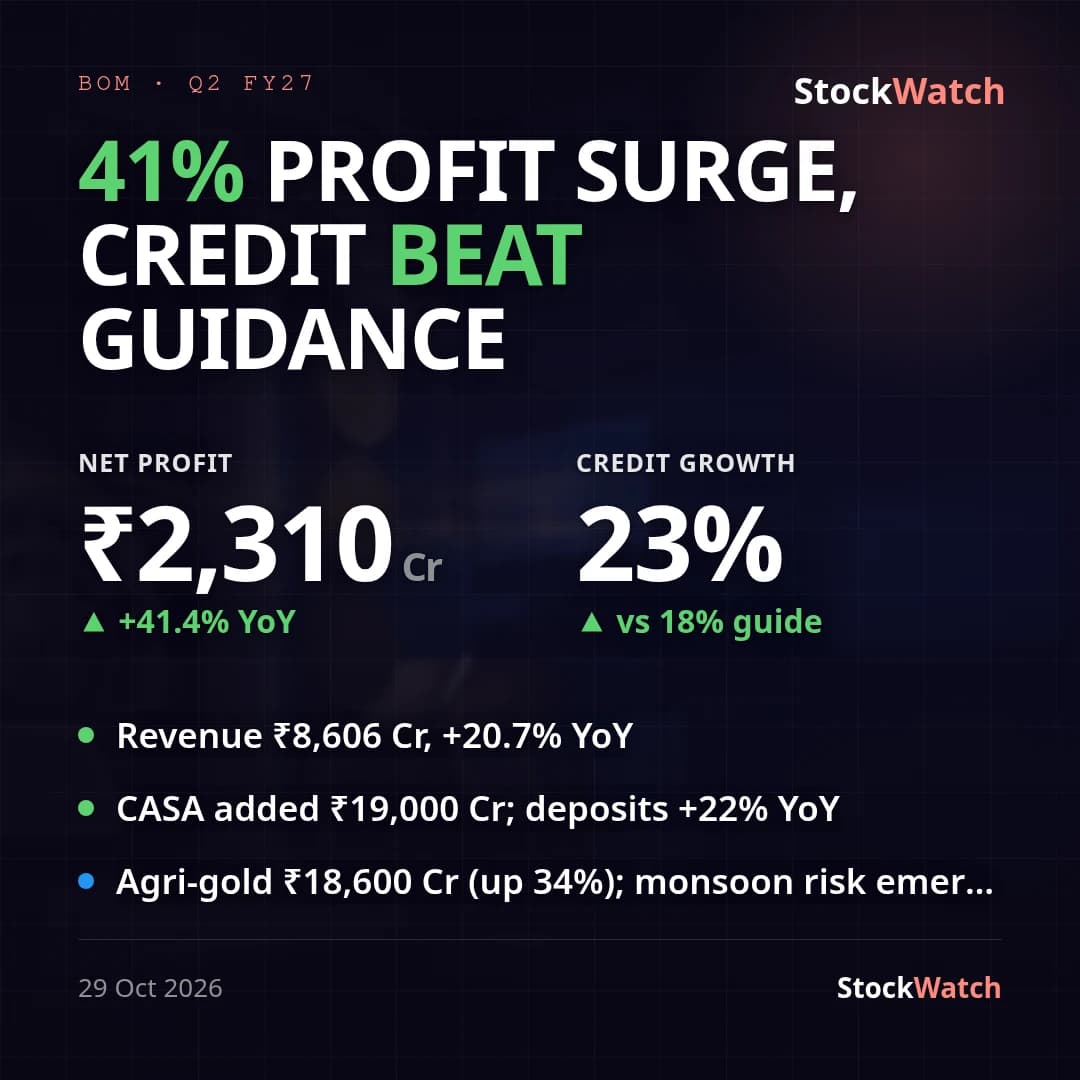 MAHABANKResult verdict29 Oct
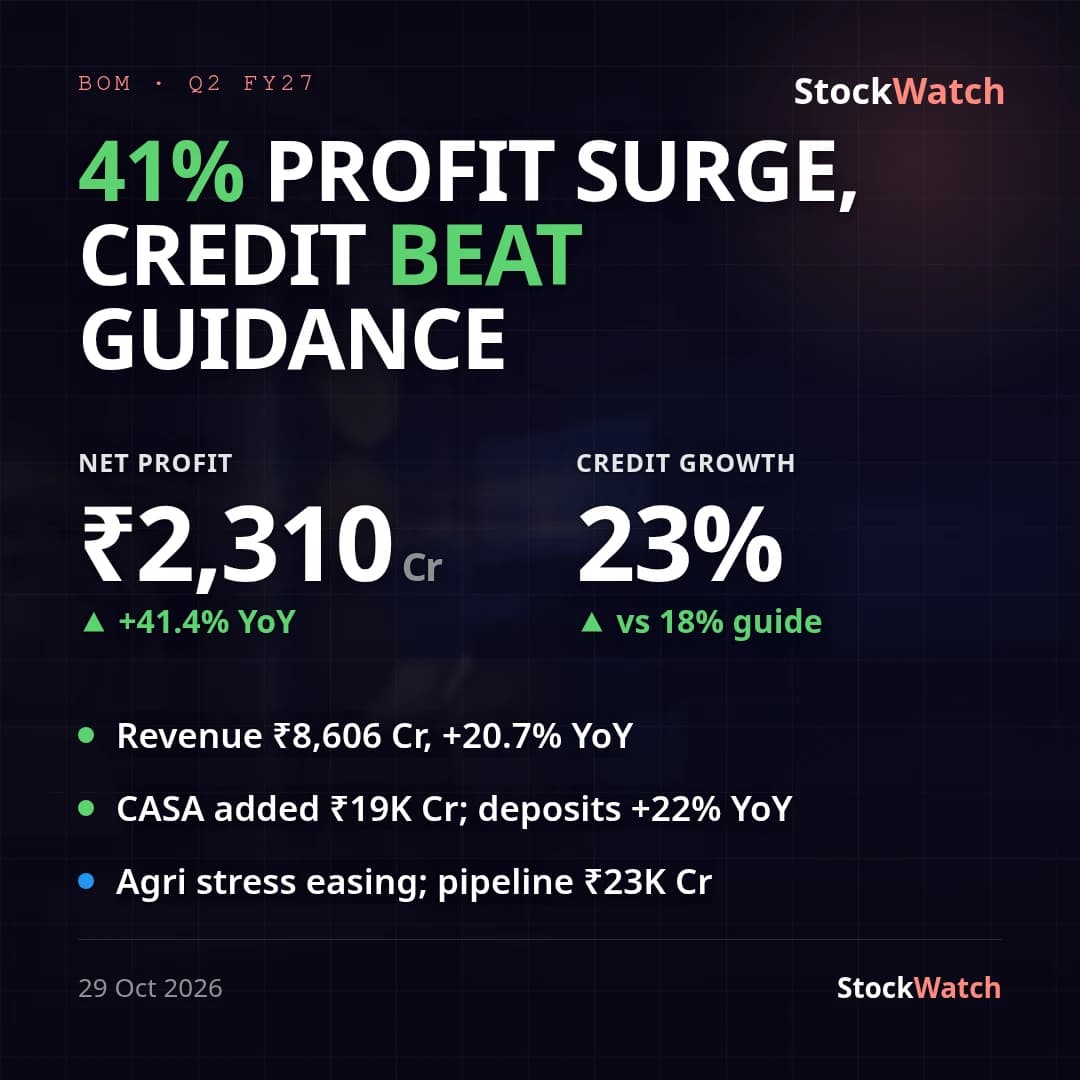 MAHABANKTranscript29 Oct
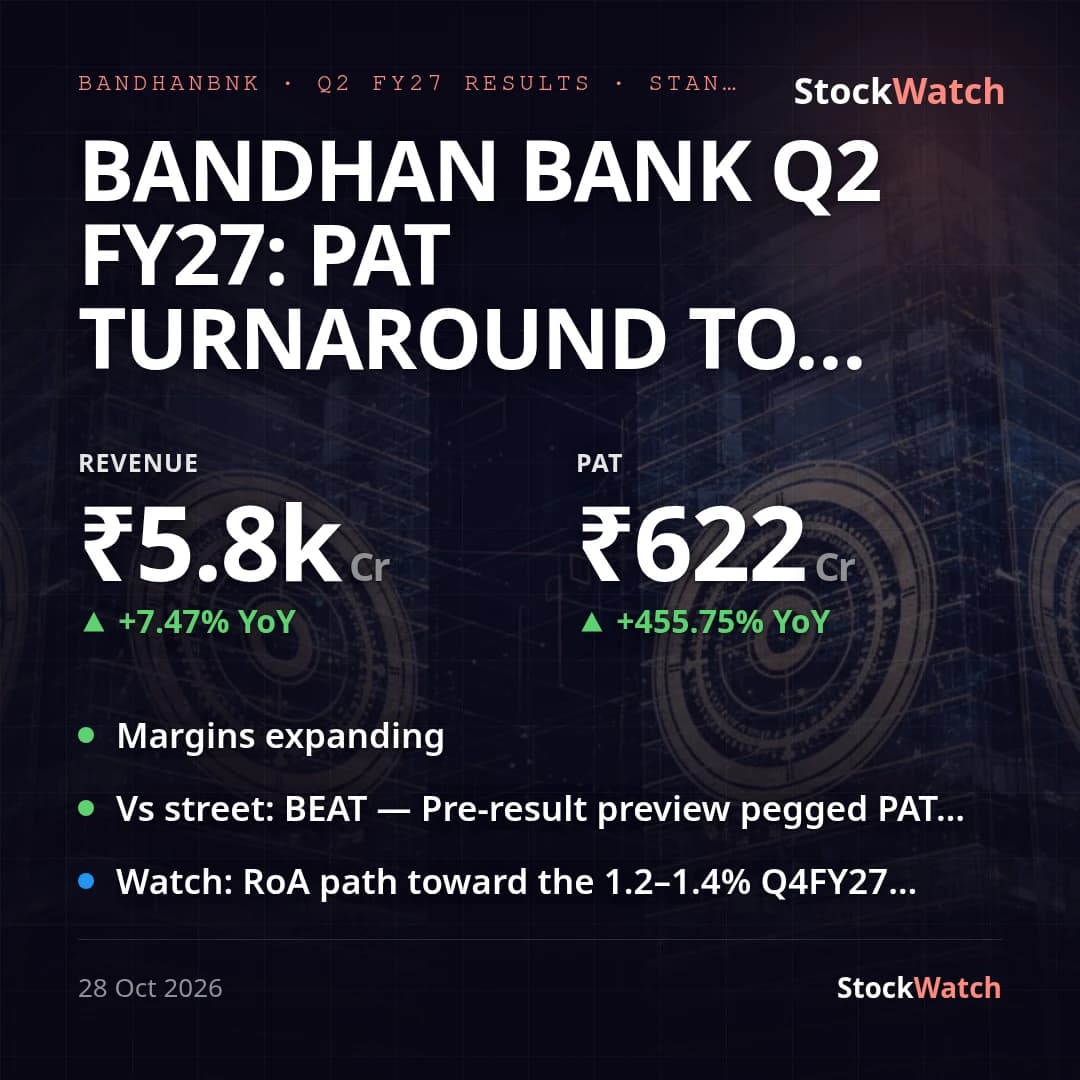 BANDHANBNKResults28 Oct
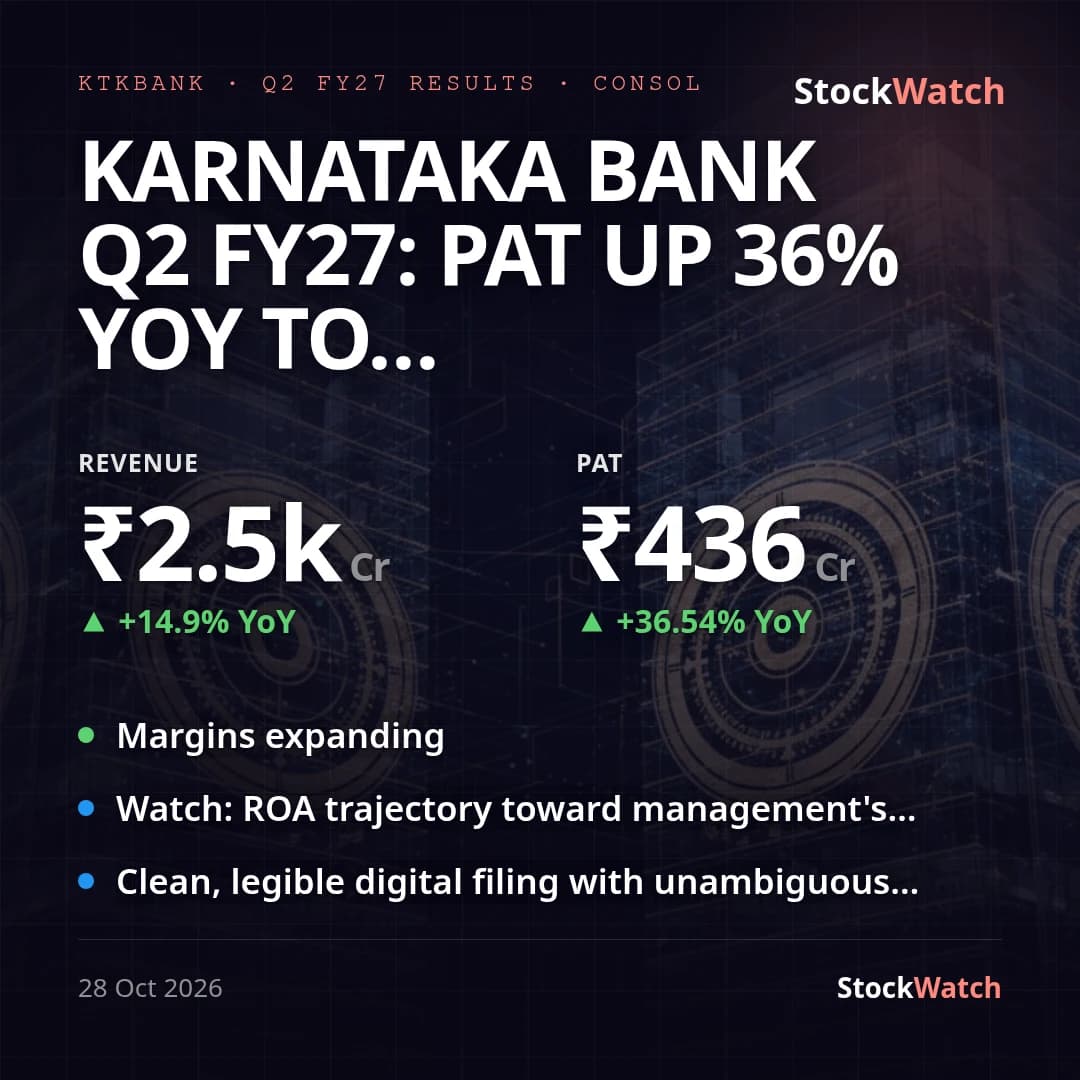 KTKBANKResults28 Oct
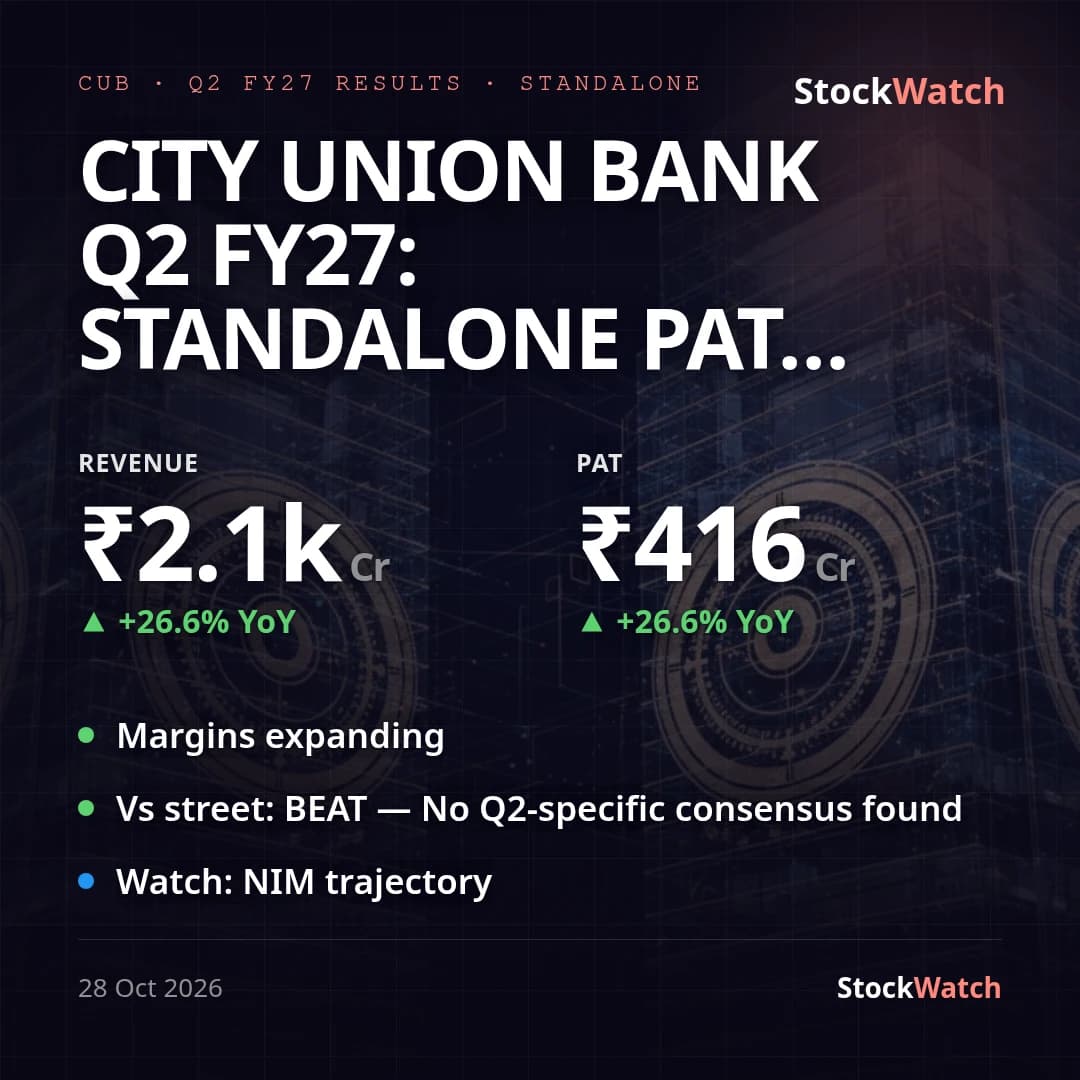 CUBResults28 Oct
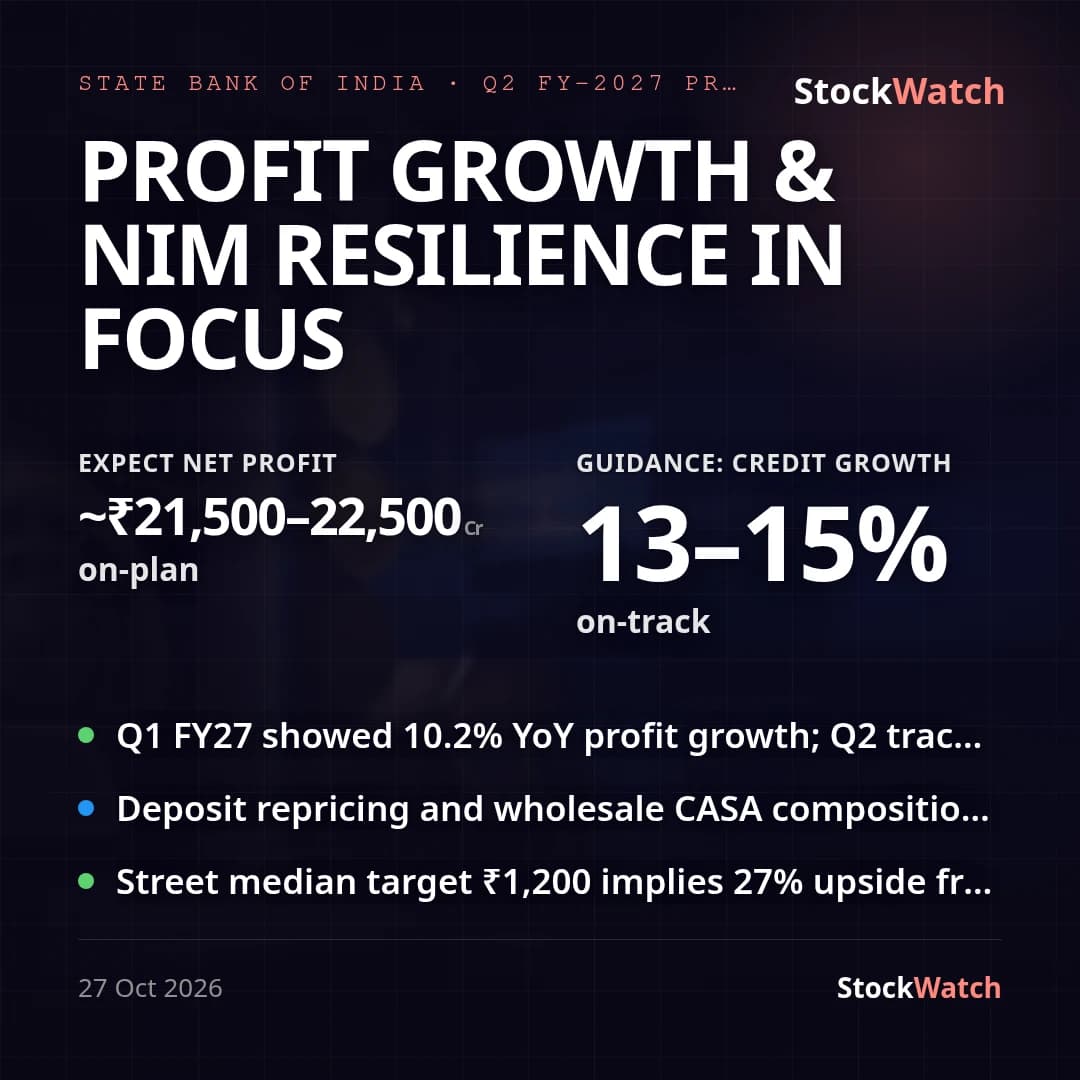 SBINResult preview28 Oct
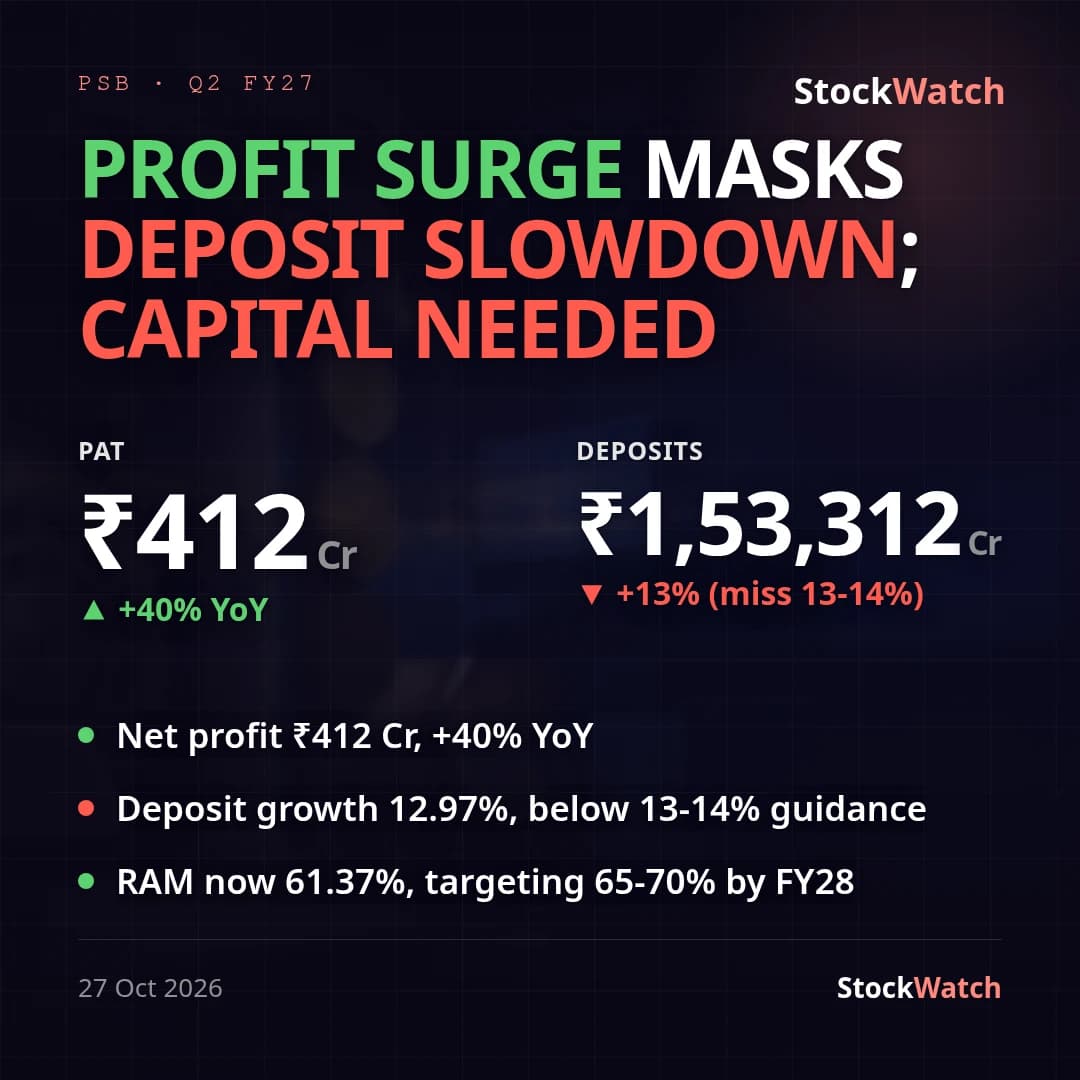 PSBResult verdict27 Oct
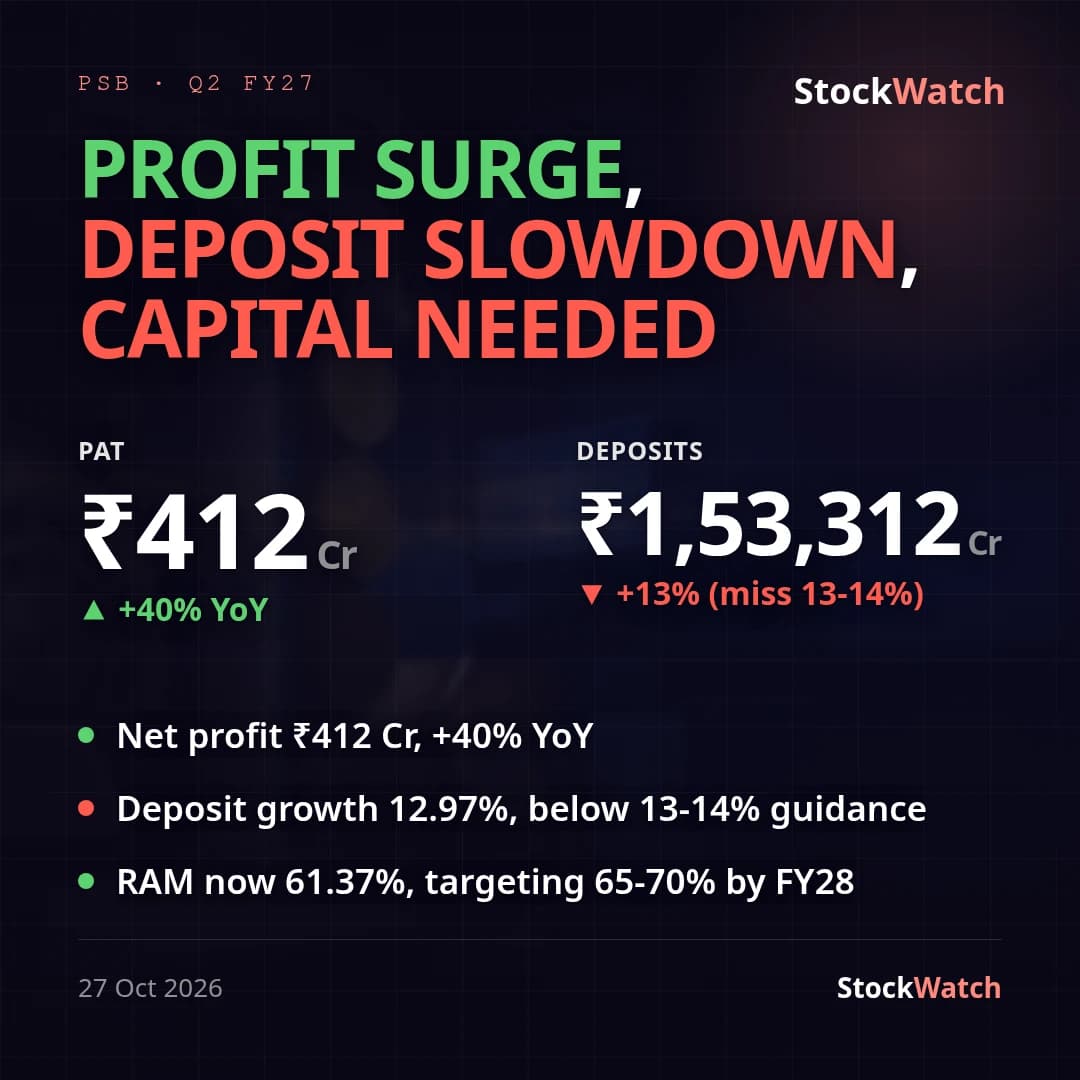 PSBTranscript27 Oct
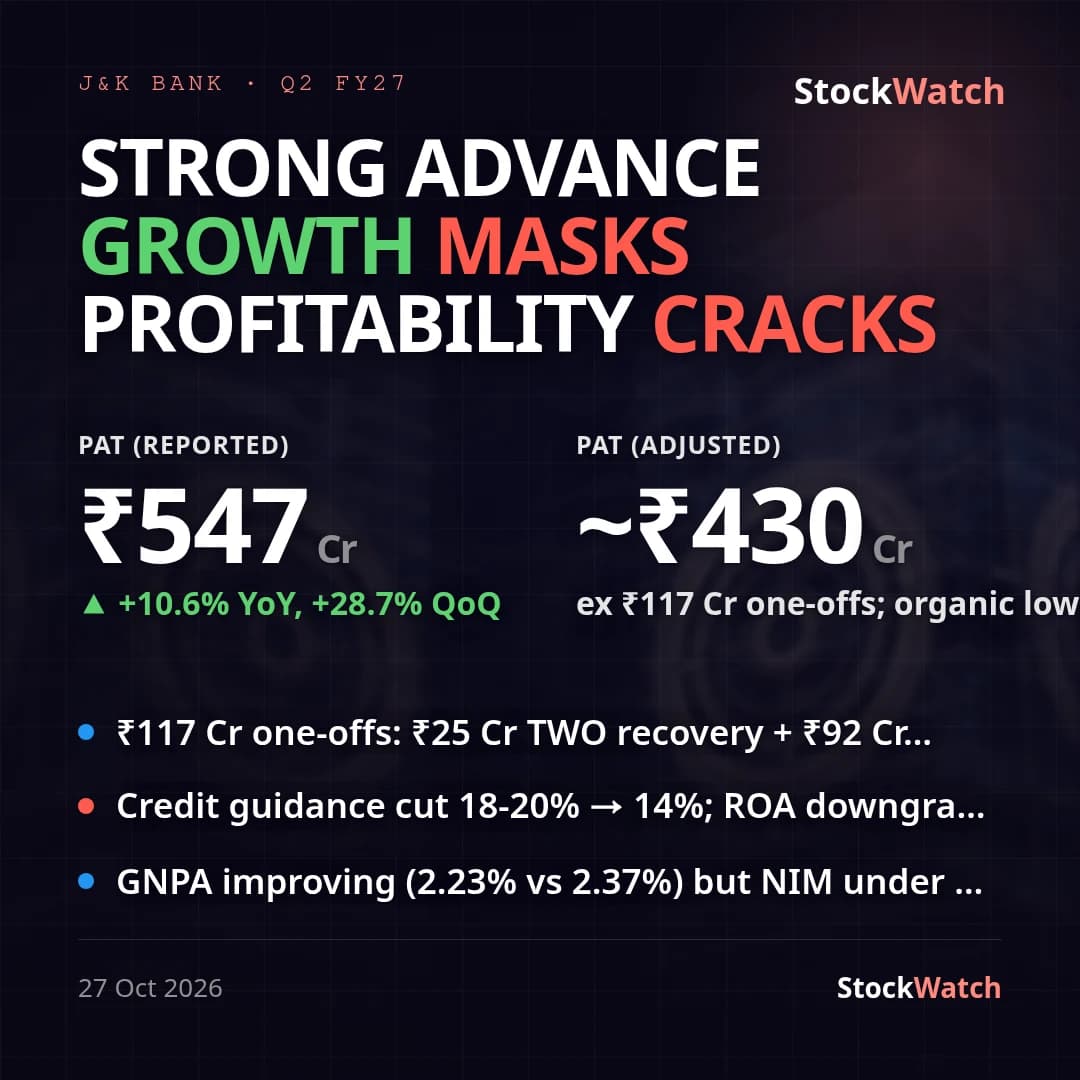 J&KBANKResult verdict27 Oct
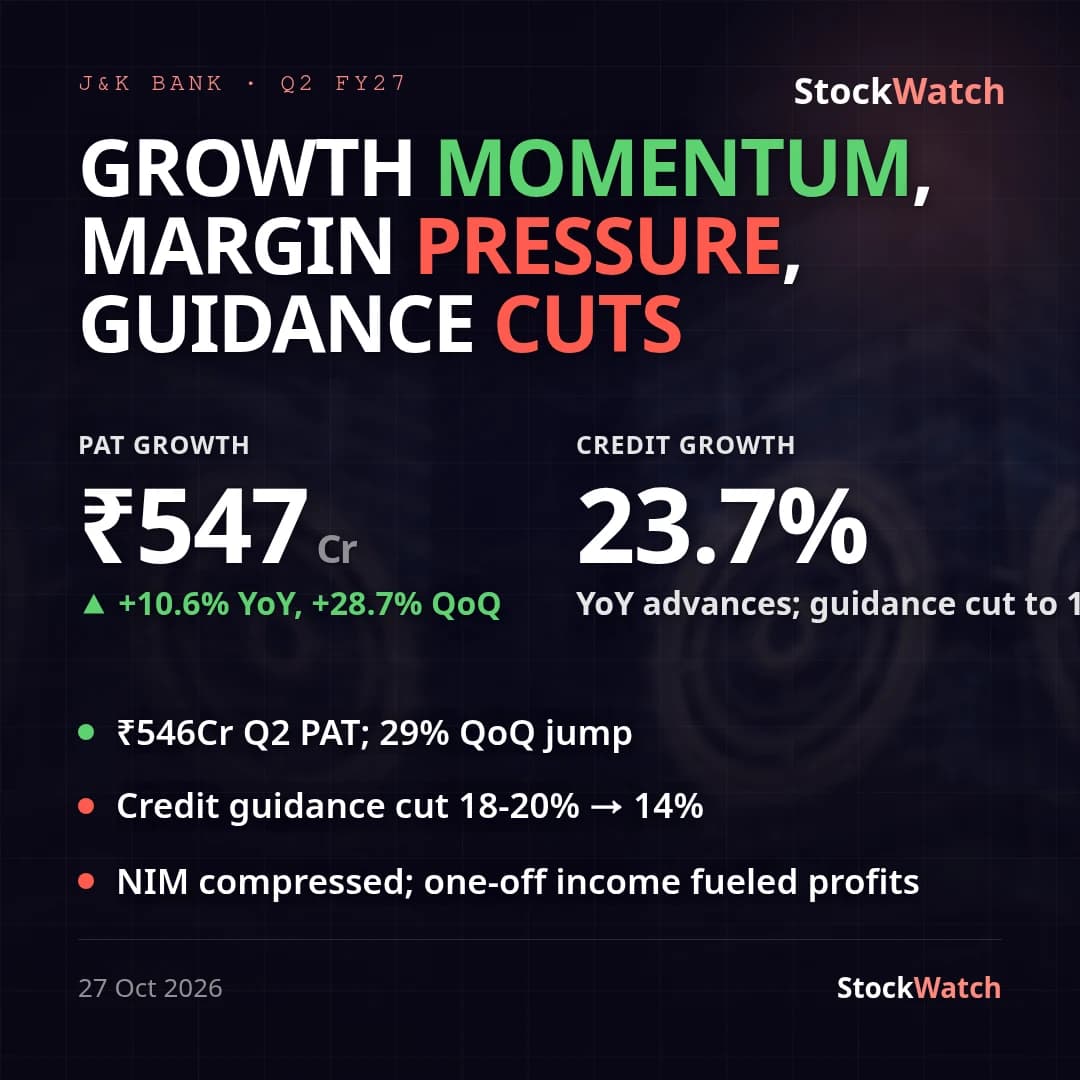 J&KBANKTranscript27 Oct
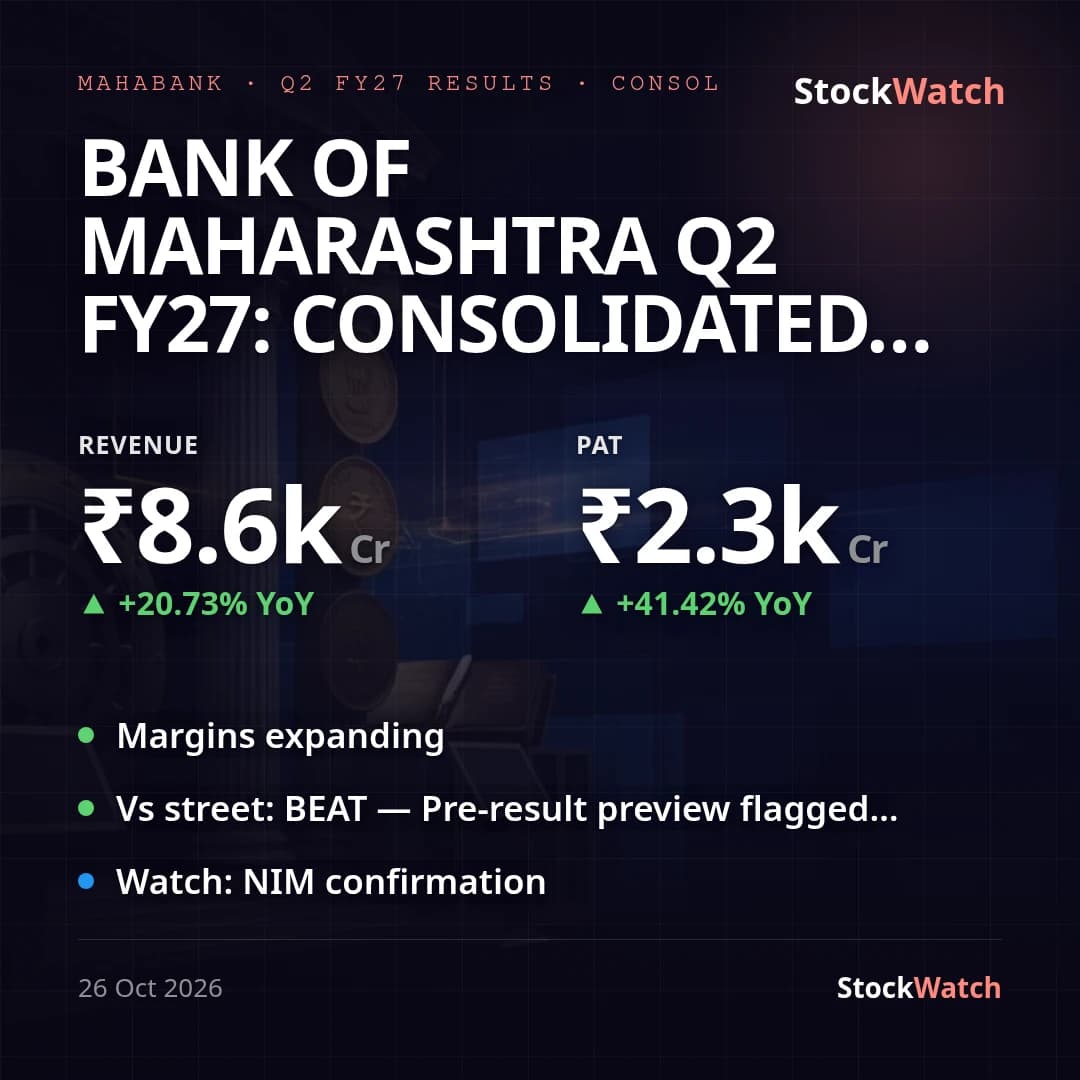 MAHABANKResults26 Oct
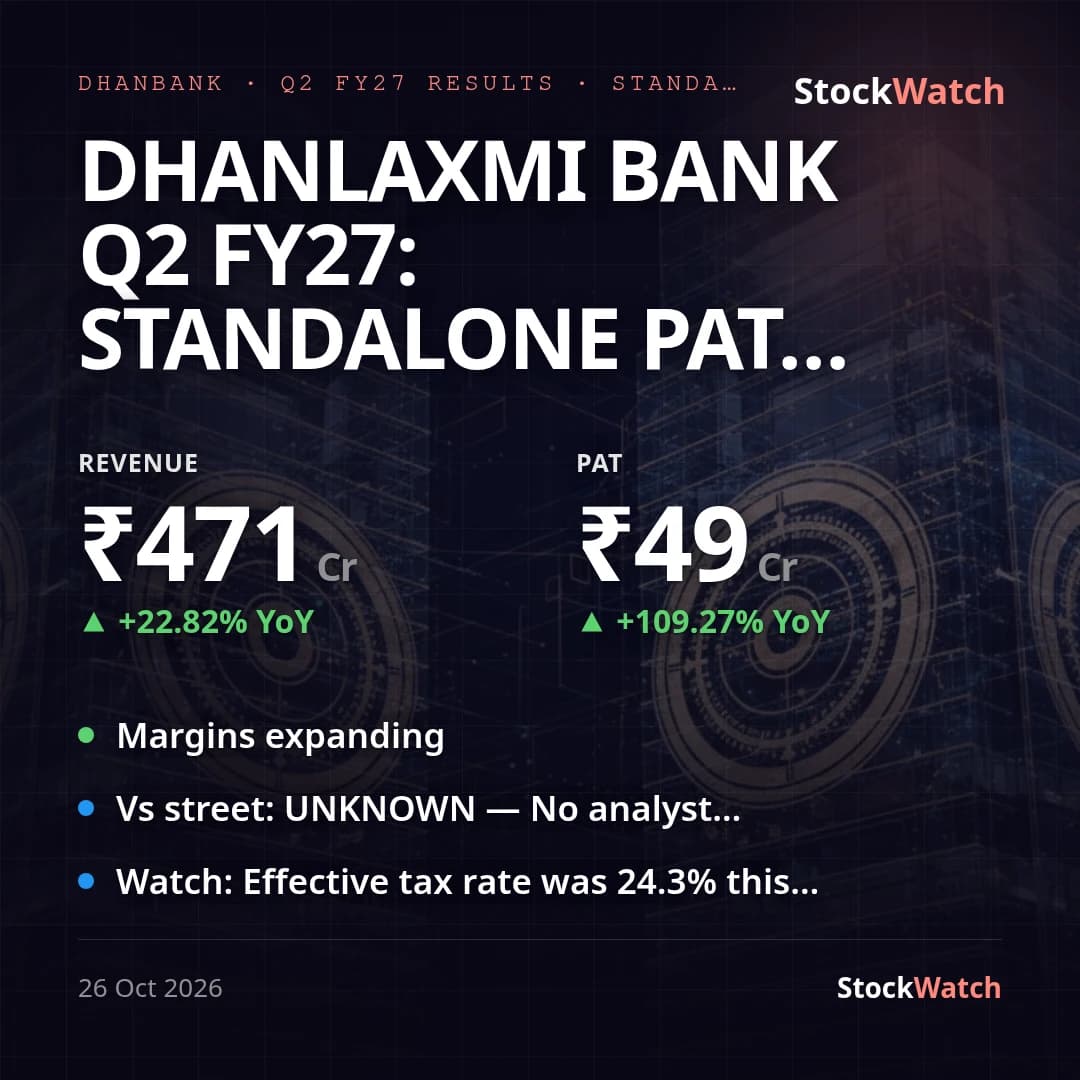 DHANBANKResults26 Oct
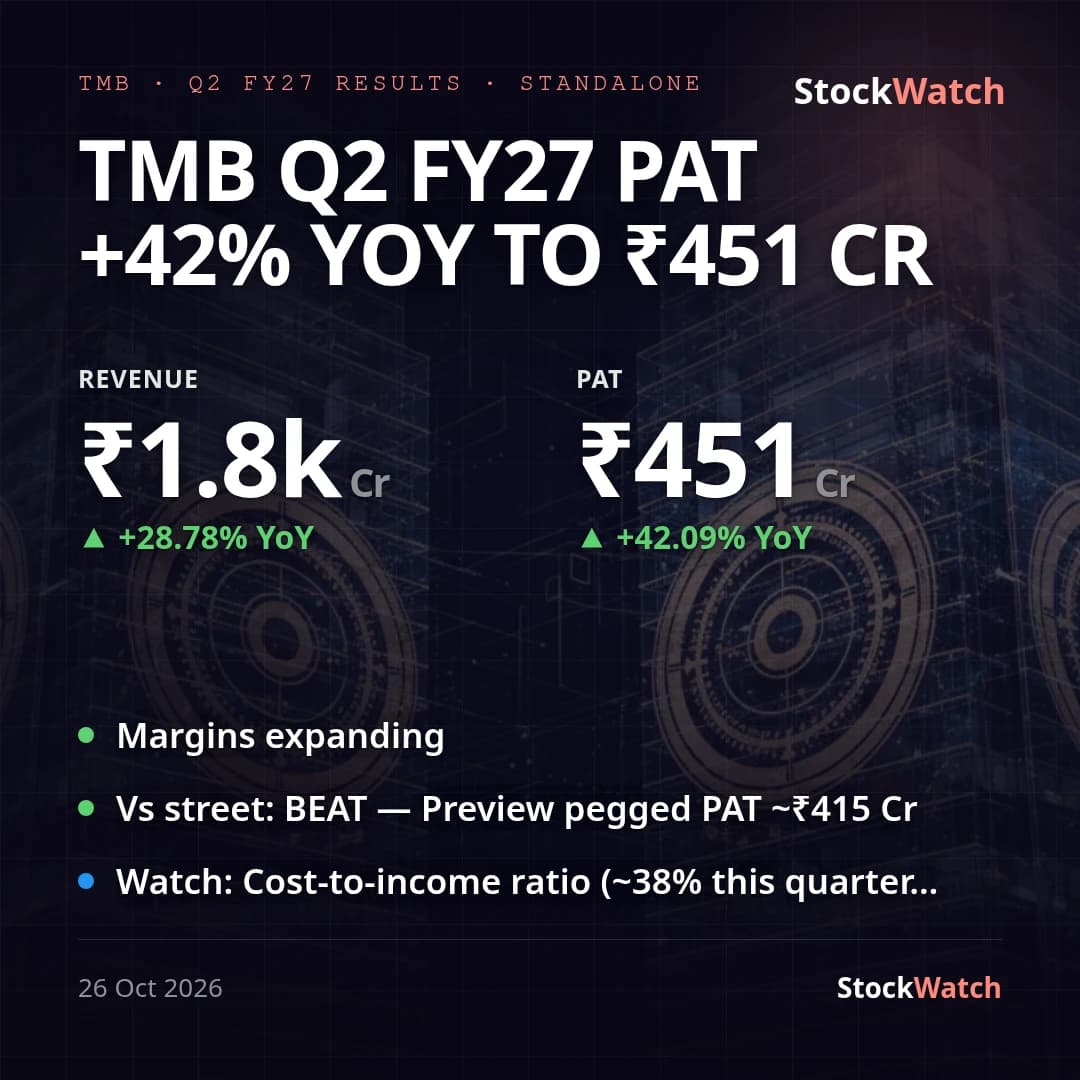 TMBResults26 Oct
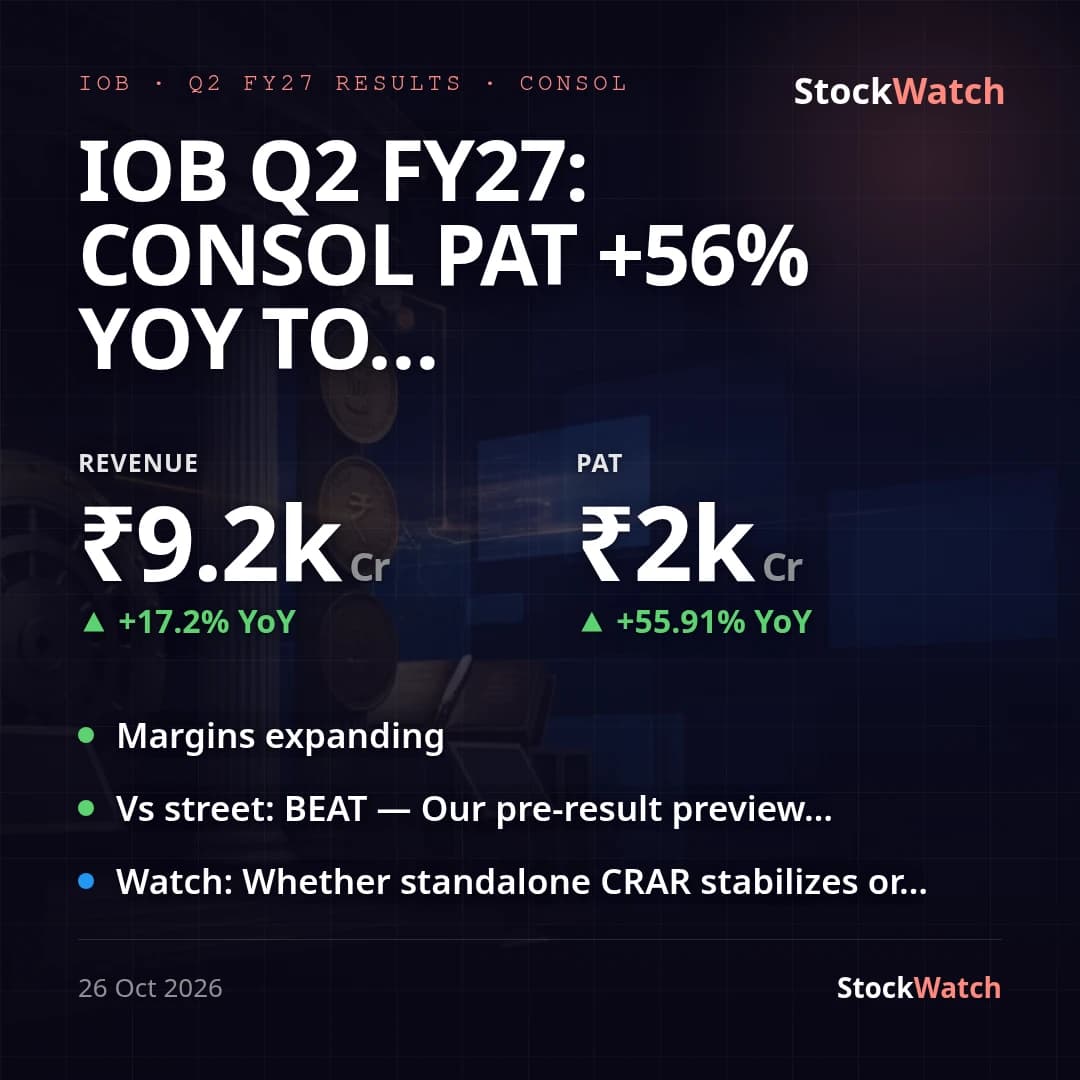 IOBResults26 Oct
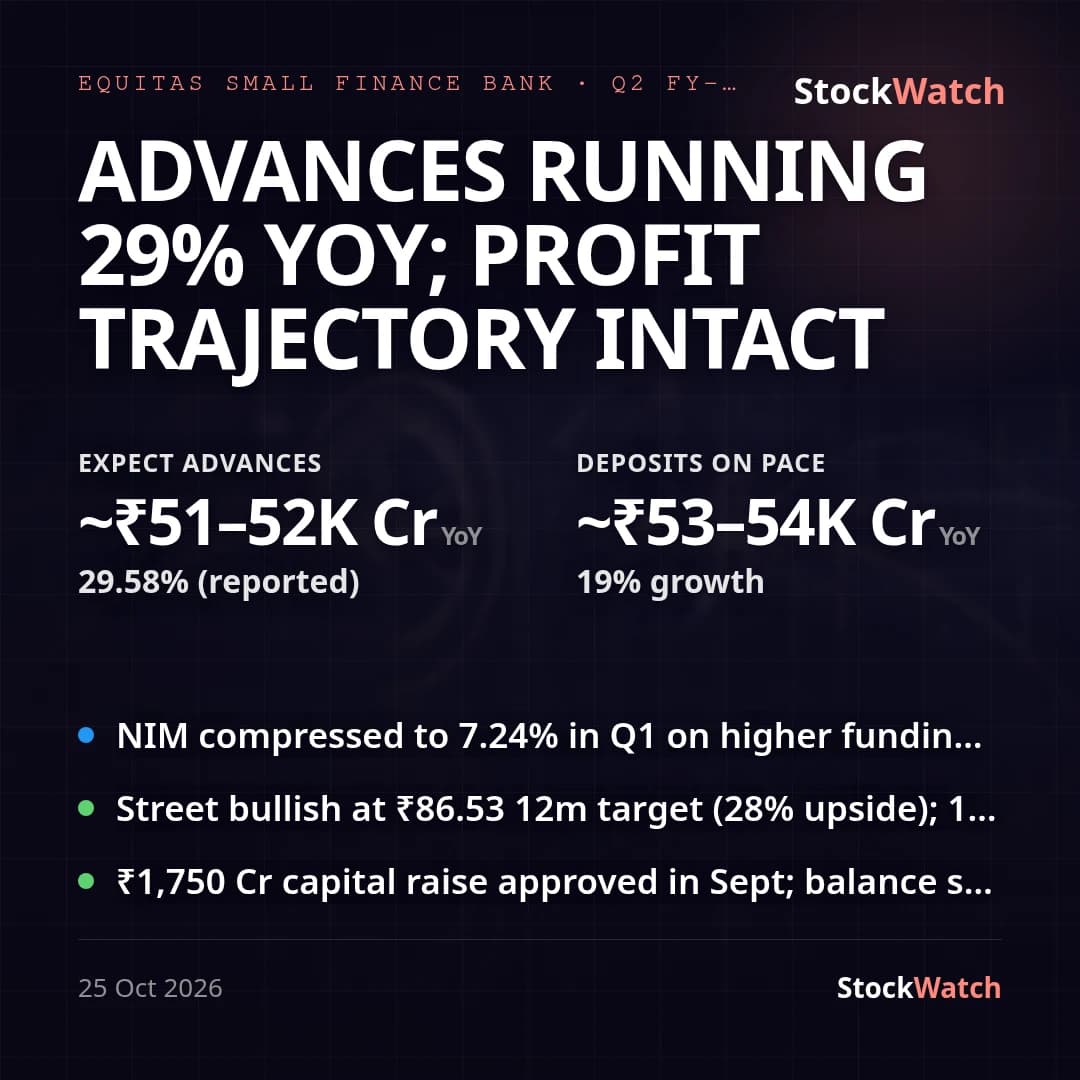 EQUITASBNKResult preview26 Oct
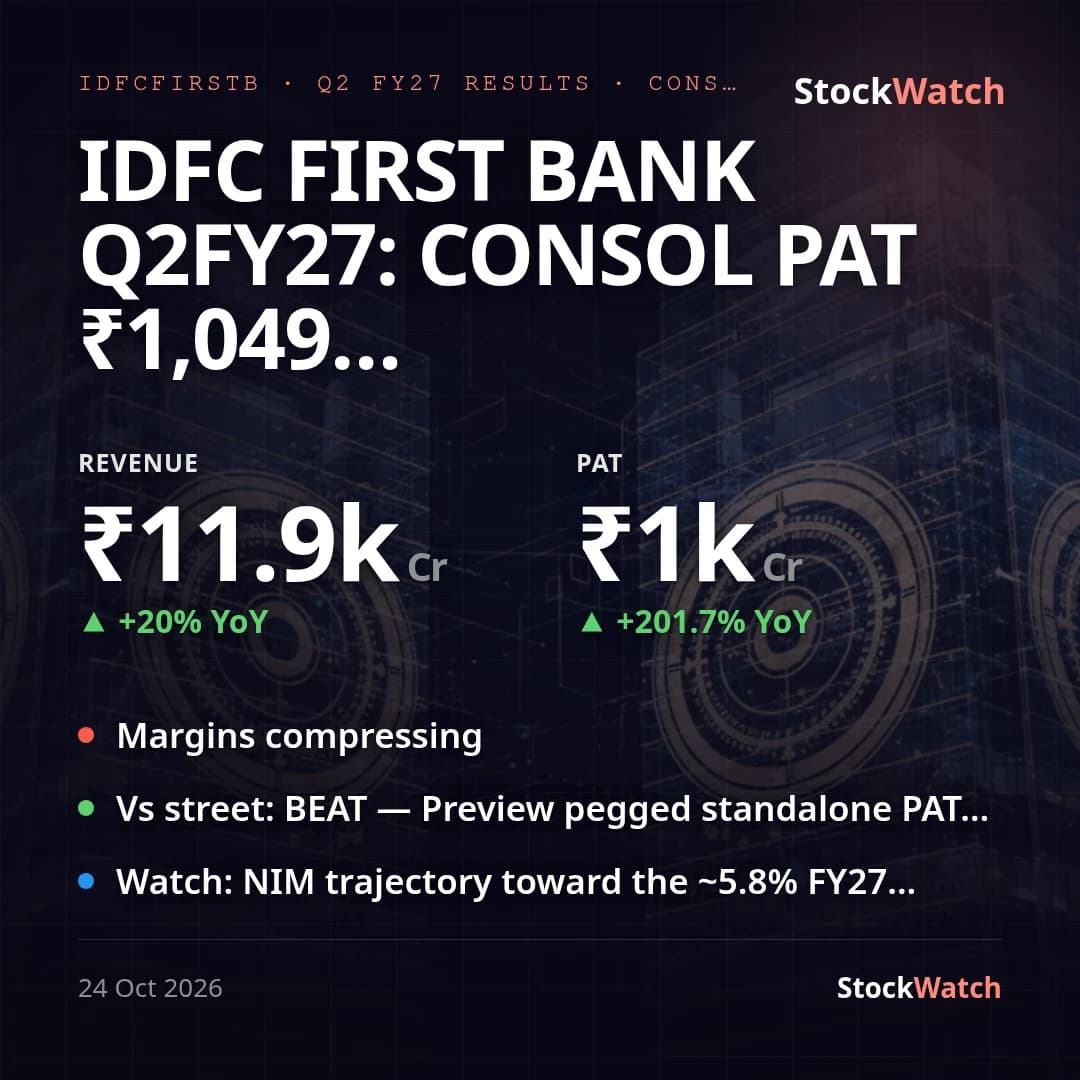 IDFCFIRSTBResults24 Oct
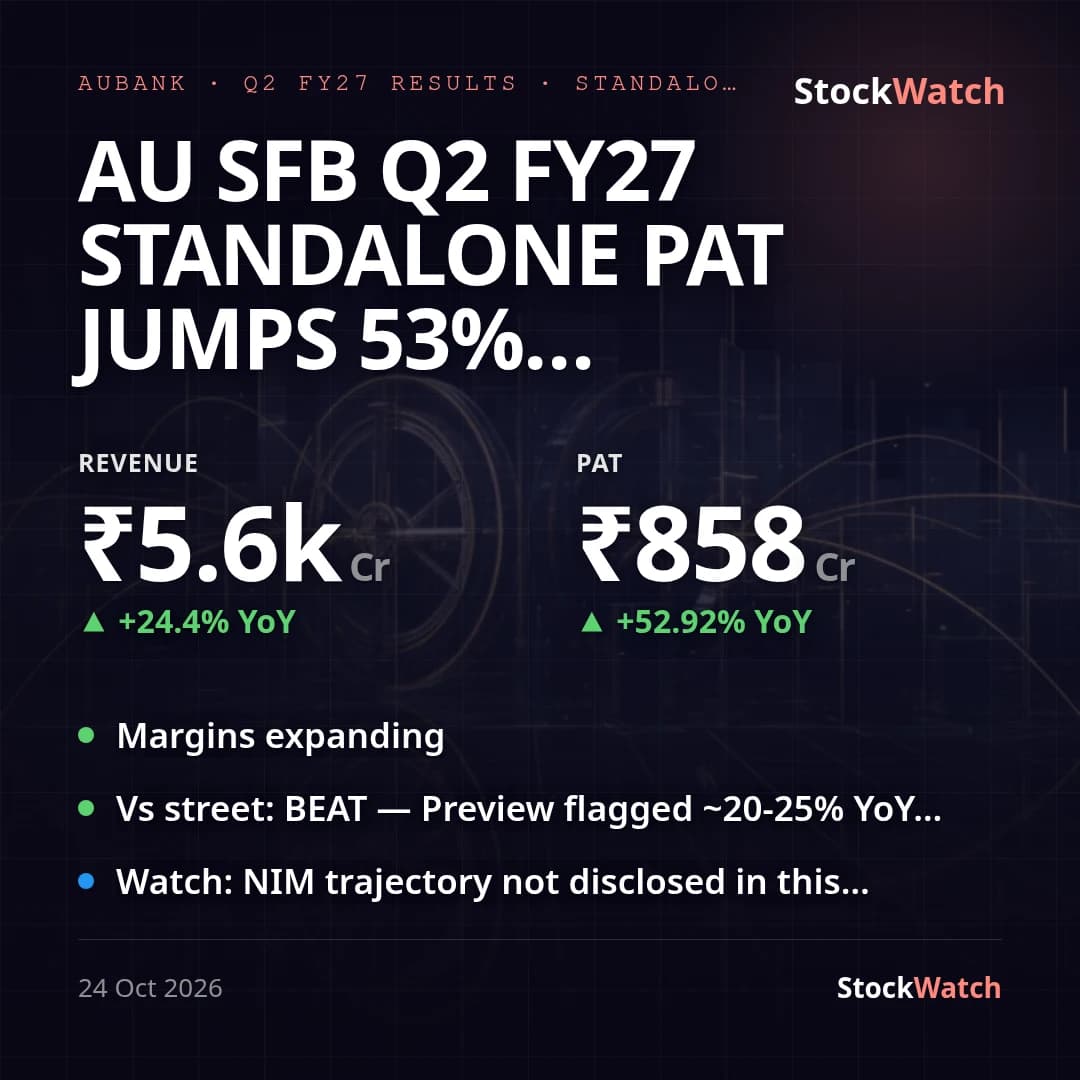 AUBANKResults24 Oct
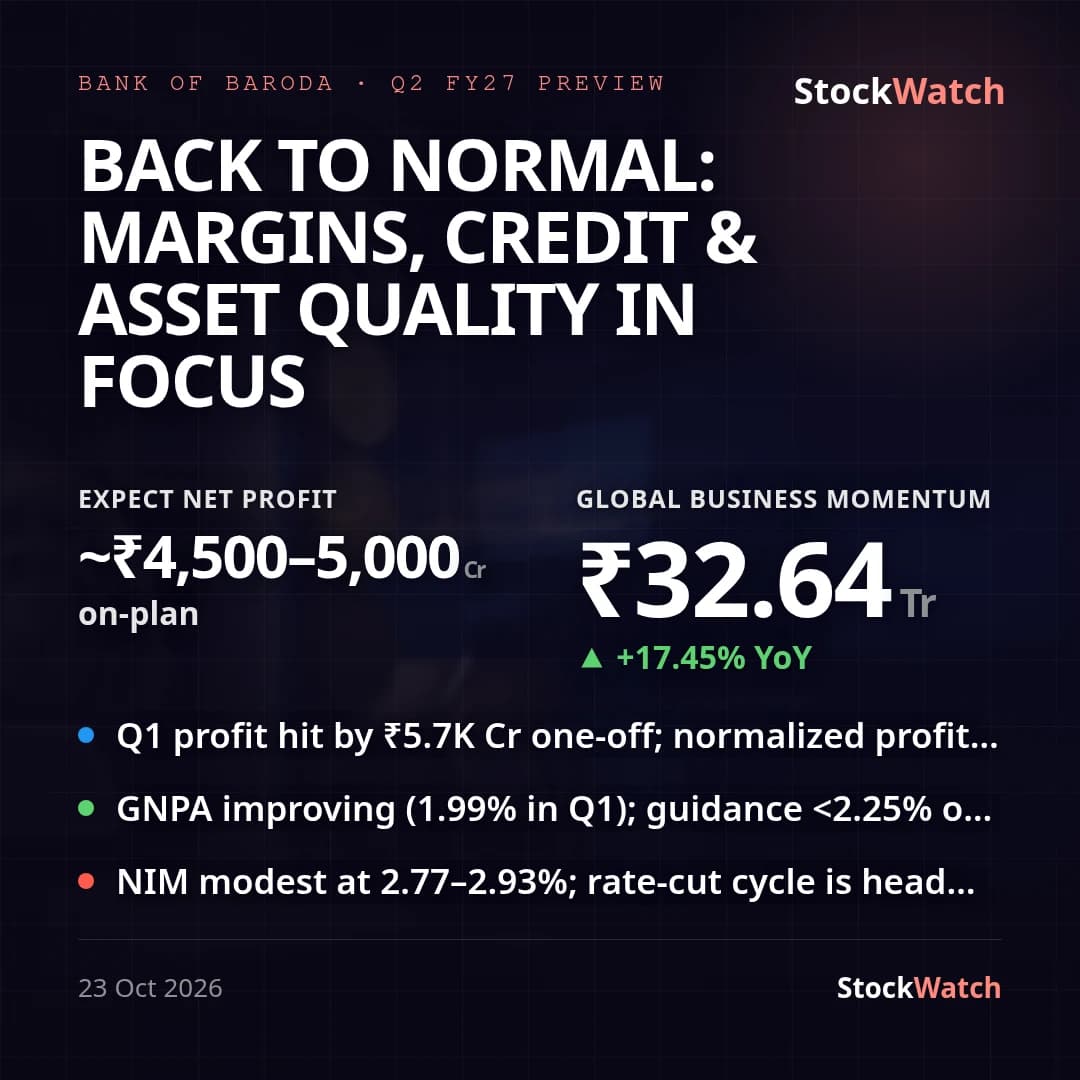 BANKBARODAResult preview24 Oct
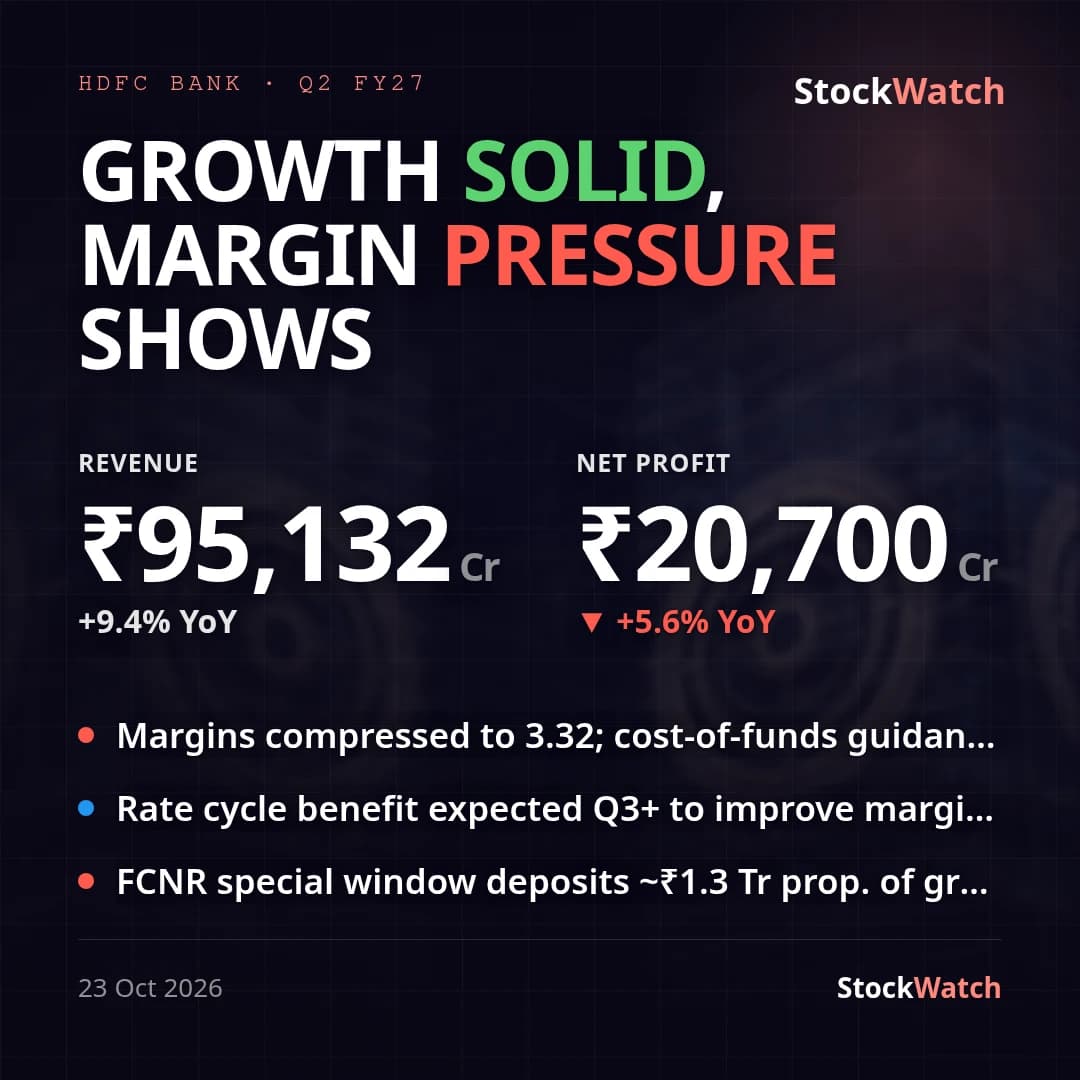 HDFCBANKResult verdict23 Oct
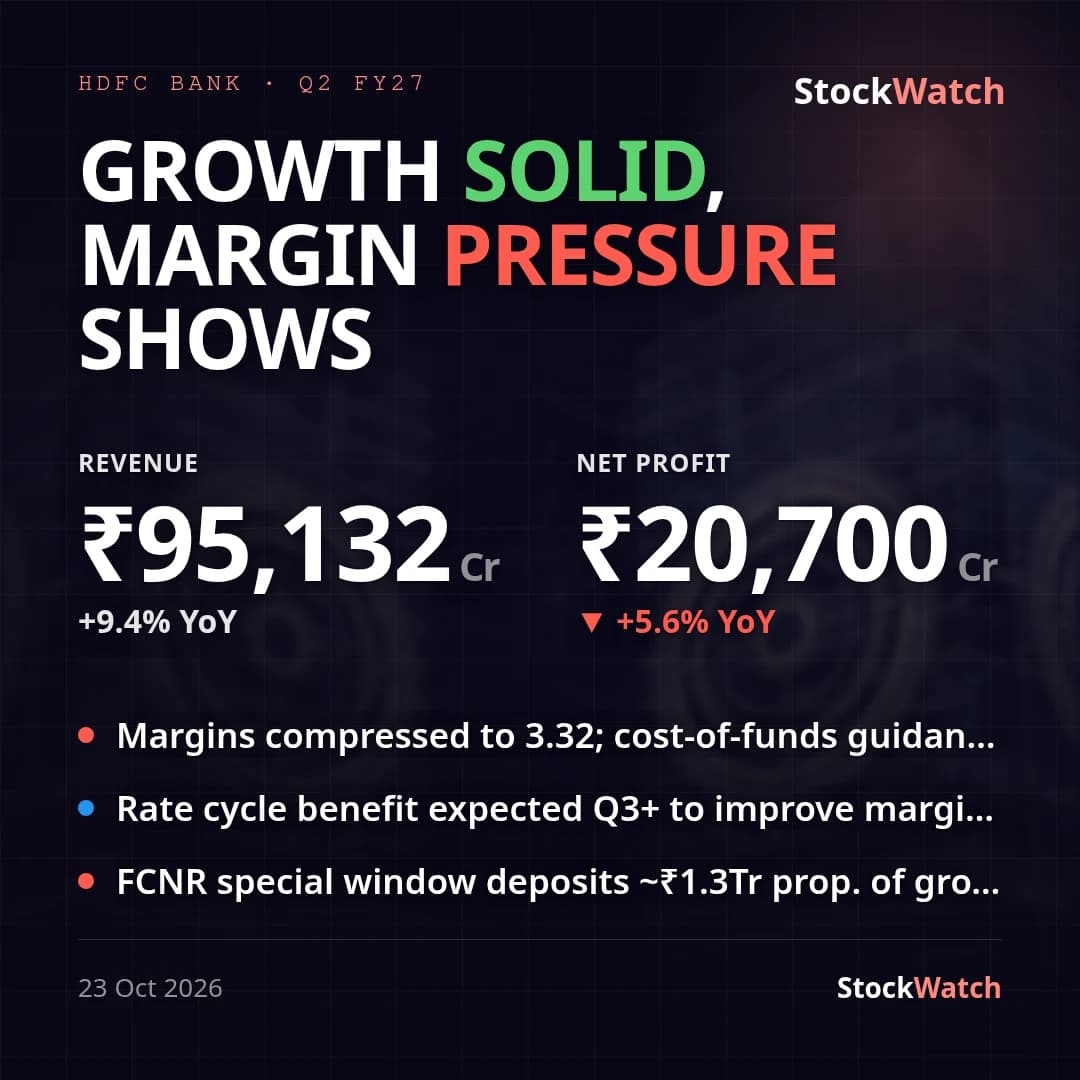 HDFCBANKTranscript23 Oct
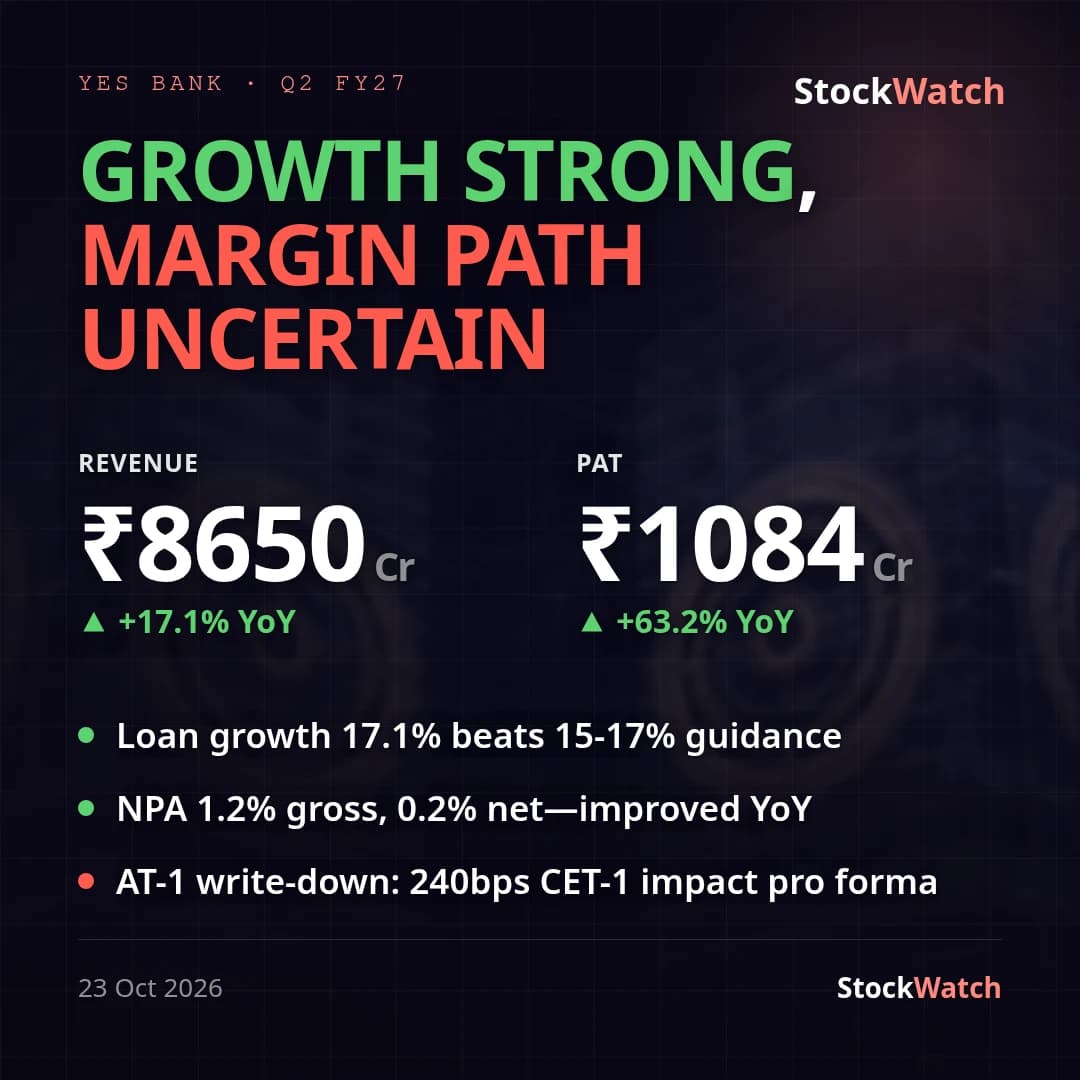 YESBANKTranscript23 Oct
 MAHABANKResult preview23 Oct
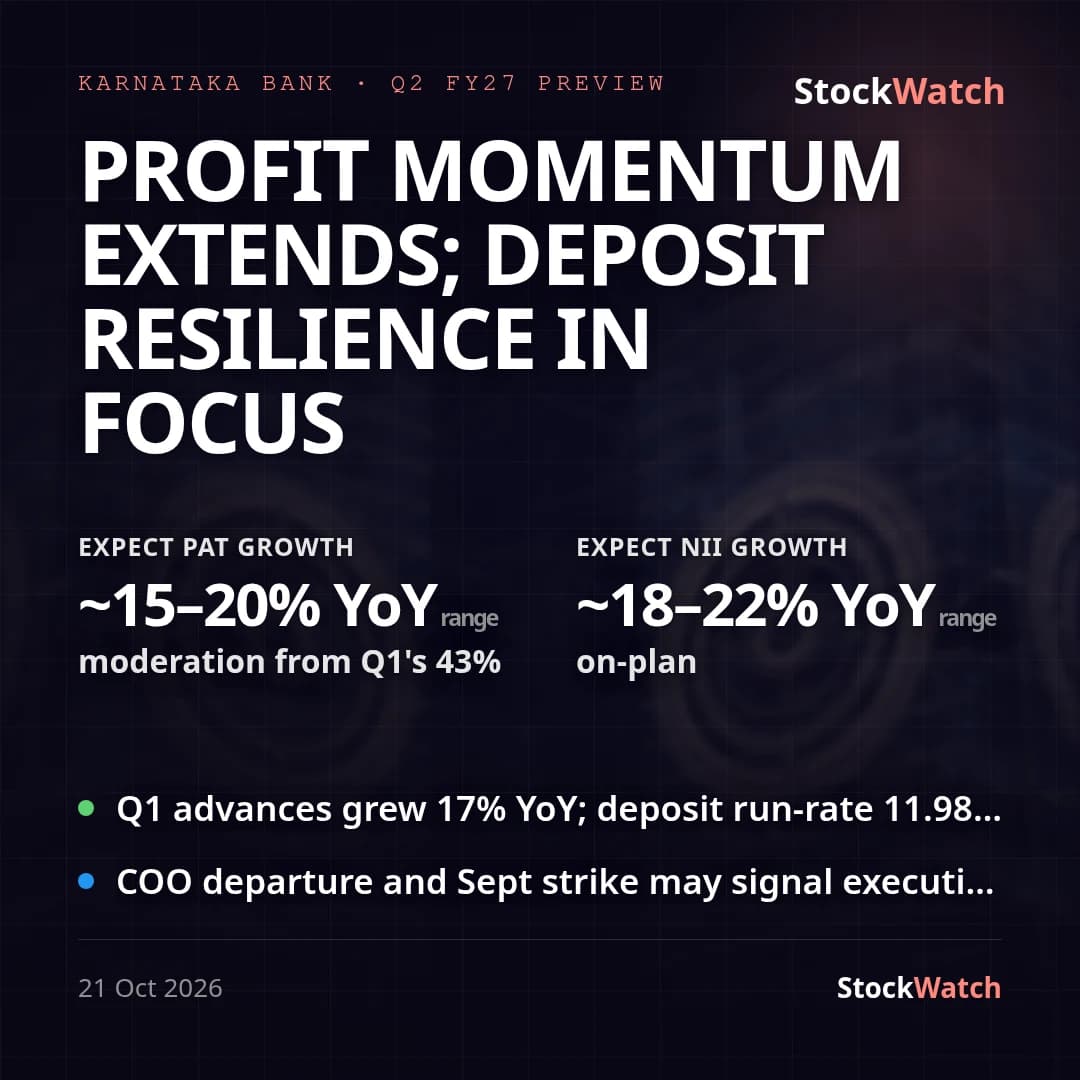 KTKBANKResult preview22 Oct
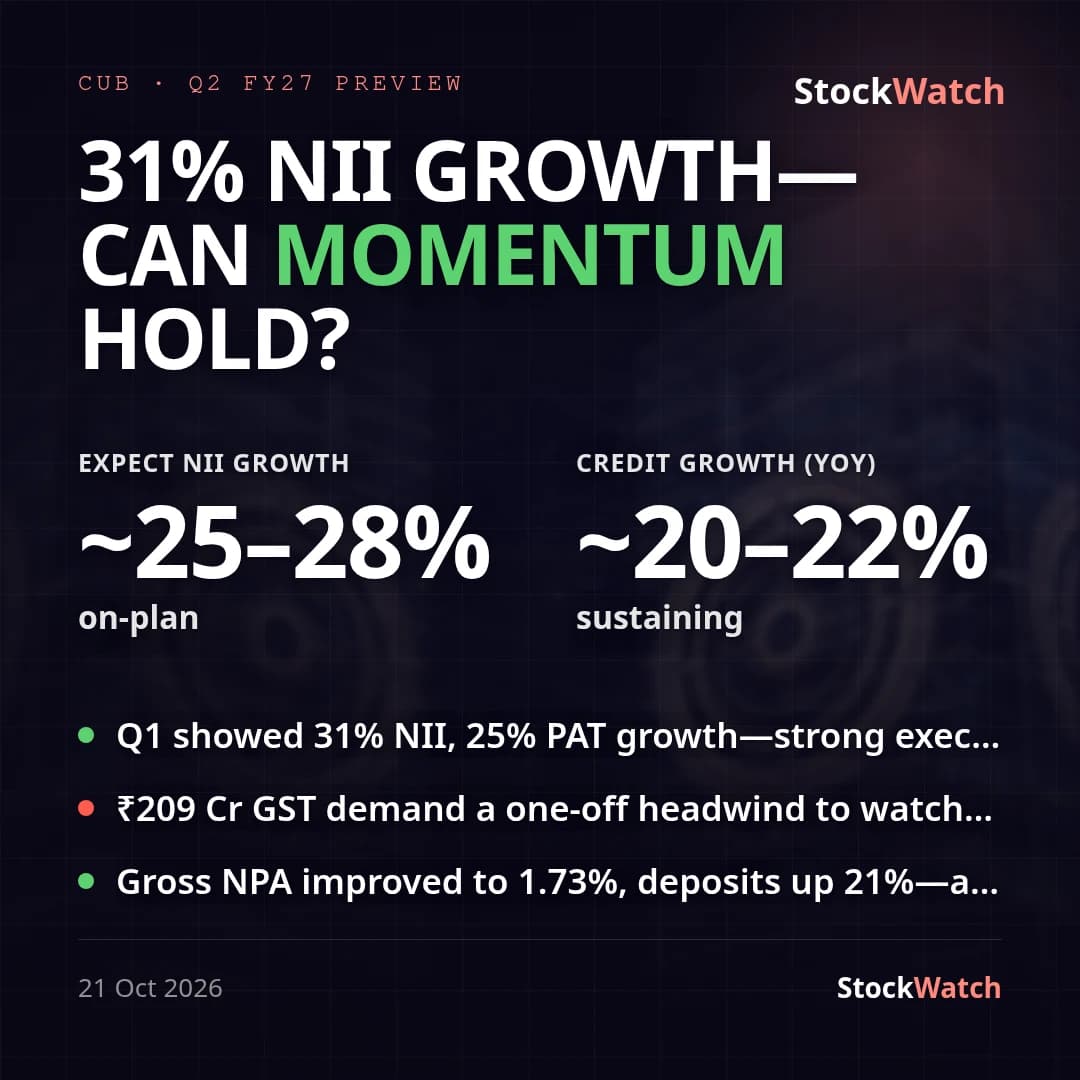 CUBResult preview22 Oct
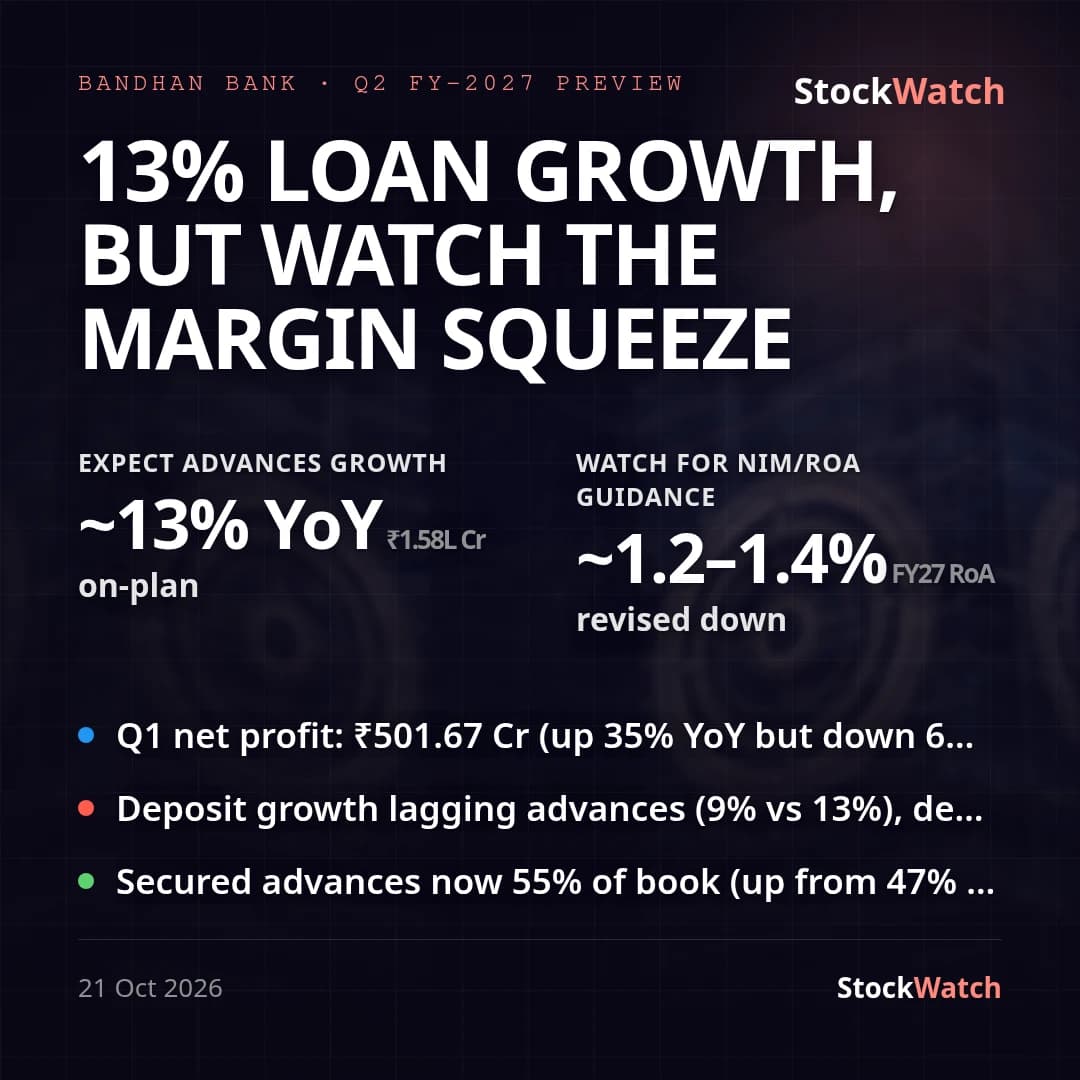 BANDHANBNKResult preview22 Oct
 IOBResult preview21 Oct
 TMBResult preview20 Oct
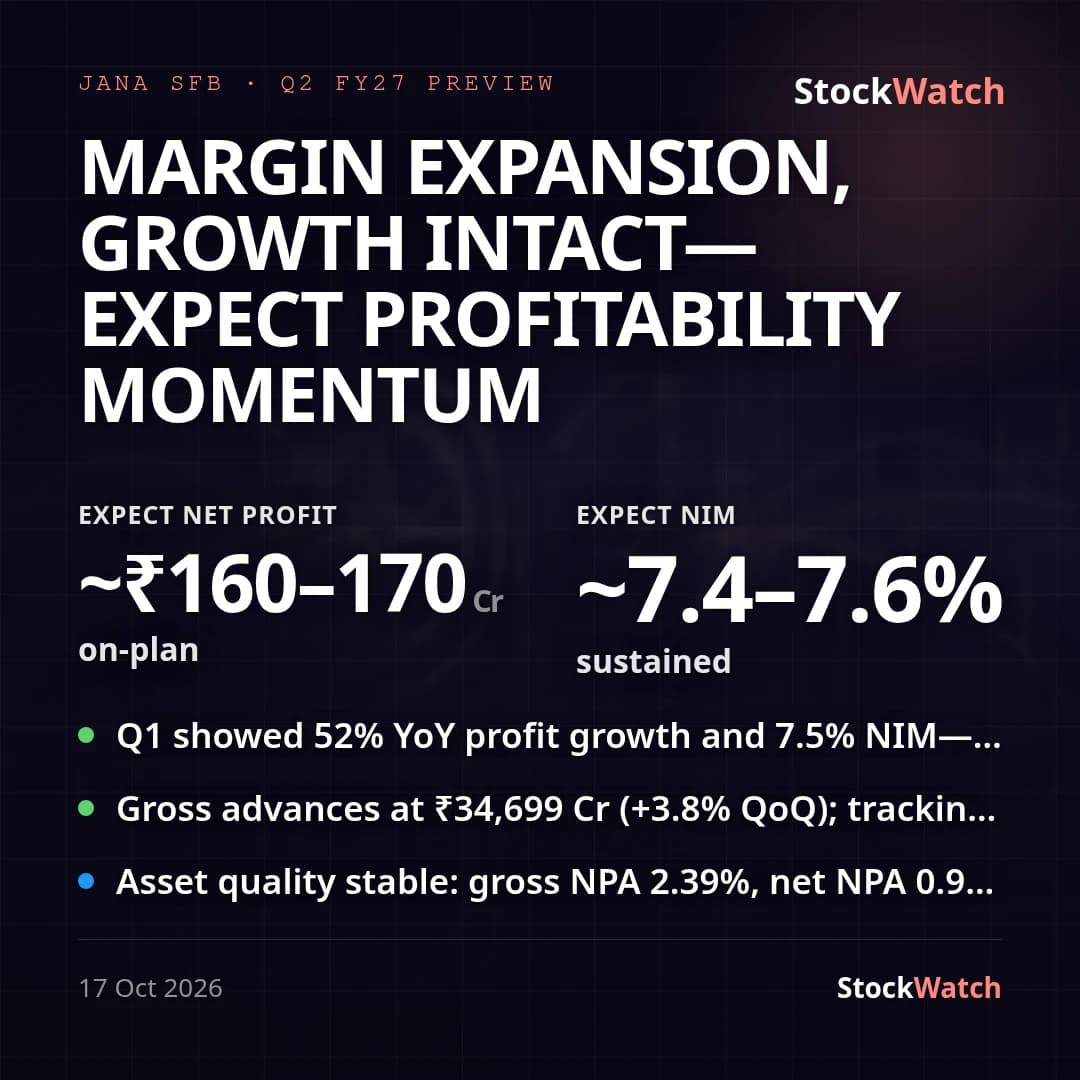 JSFBResult preview18 Oct
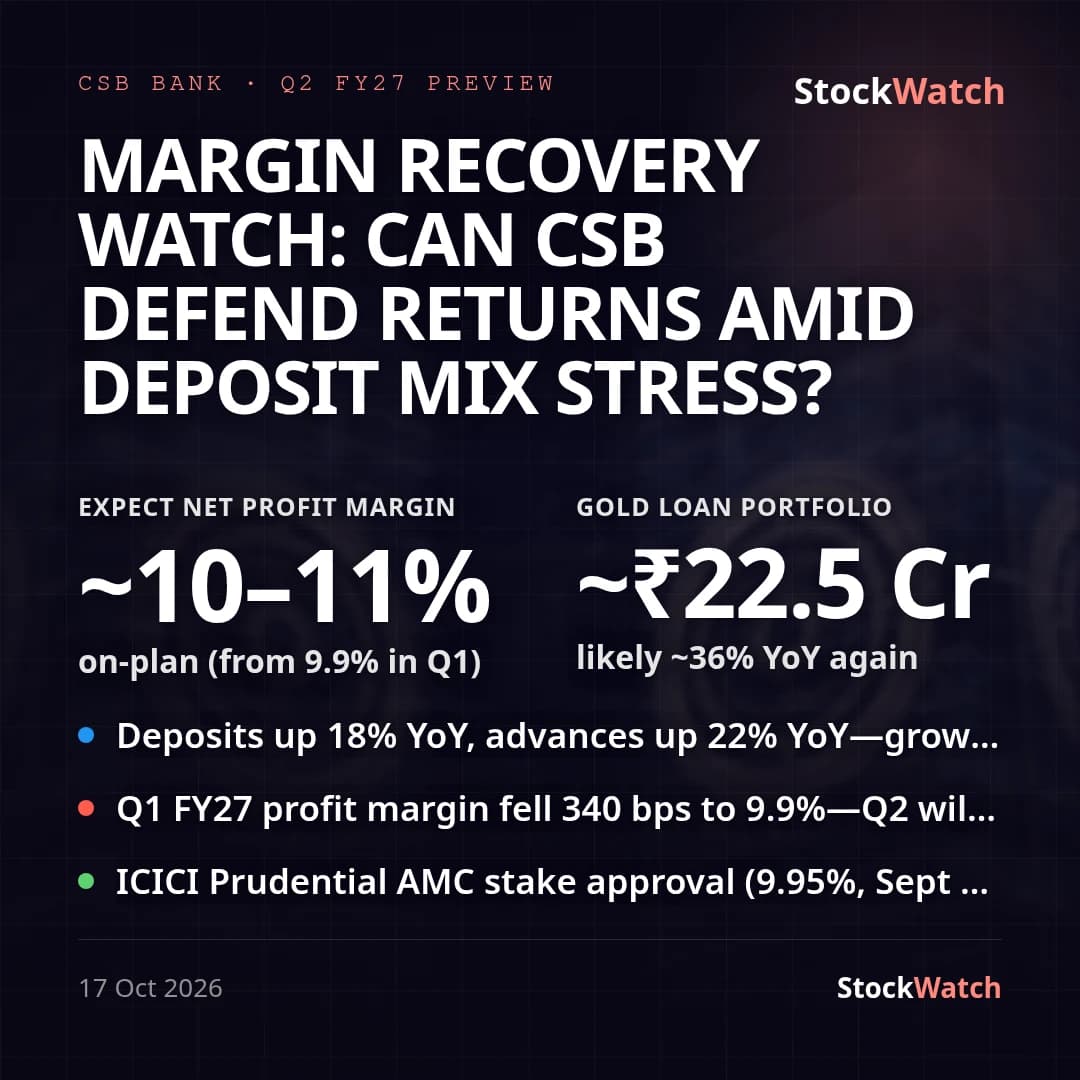 CSBBANKResult preview18 Oct
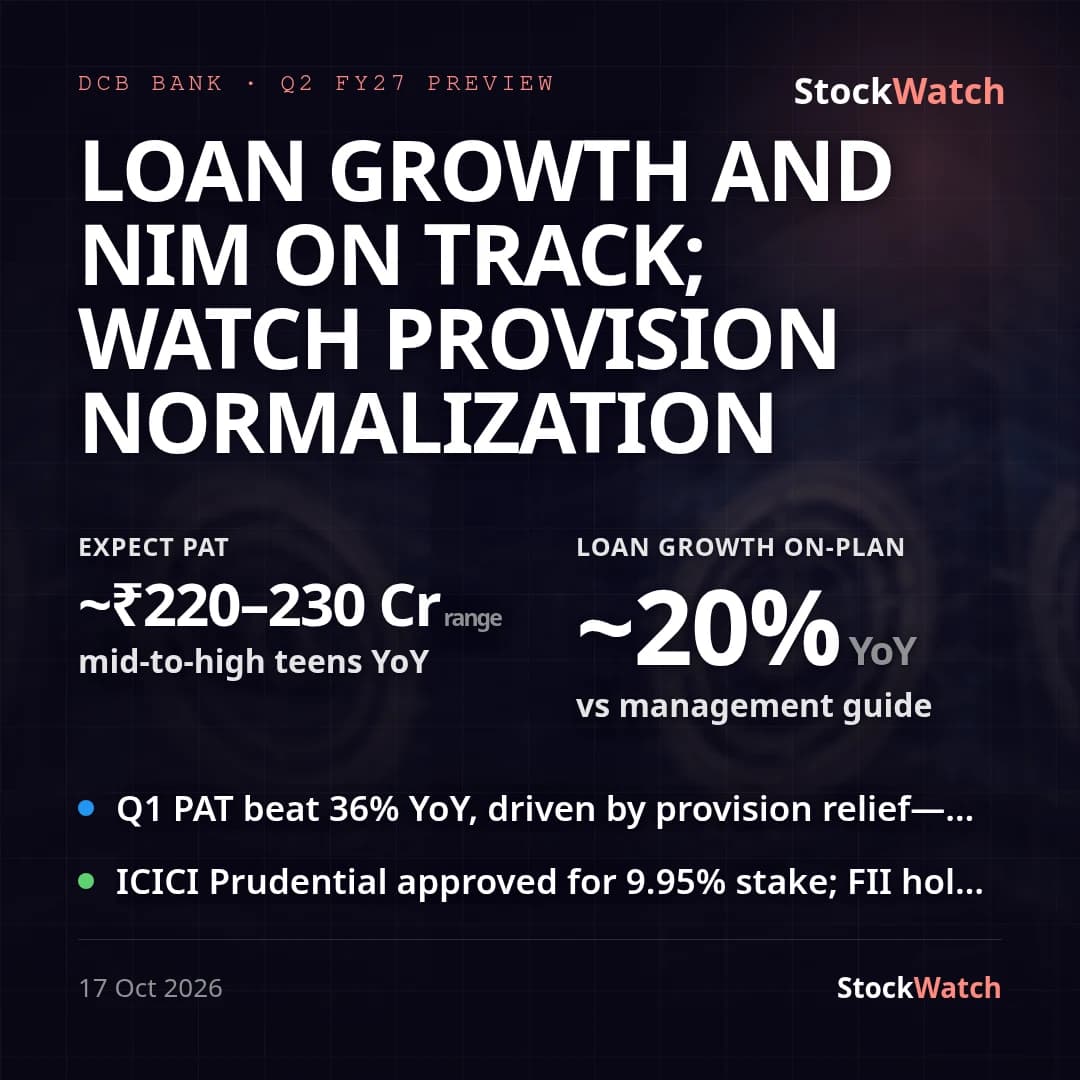 DCBBANKResult preview18 Oct
Reaction
Median day-1 move 0.6% · 22 up, 18 down of 40 priced
StockWatch Result Rating is our own rating of the reported quarter, not of the stock; counts are of quarters rated so far.
Results from companies below ₹100 Cr market cap are not rated, and a result is rated only once its final numbers are filed; "ratable" counts the results that qualify, plus any already rated.
Growth: year-on-year vs the same quarter of Q2 FY26, one basis per company (consolidated where both years report it, else standalone); banks, financial services and insurers by total income. Aggregate = growth of the summed values; median = the middle company. A company whose prior-year profit was a loss has no profit growth figure.
Day-1 reaction = the stock's move on the first session after the result, % vs the last close before it; medians are over quarters with a priced reaction.
Sectors are the 13 StockWatch groups; 257 quarters (diversified or unclassified companies) count in the totals but in no sector.
Size bands by market-cap rank across all listed companies we track: large = top 100, mid = 101-250, small = the rest.
Median vs trimmed median (S-3): `median` includes every company. `trimmedMedian` drops companies whose growth exceeds ±1000% — a fixed threshold, not a percentile of the tails — because a prior-year revenue near zero reads as six figures of growth (one company went 0.05 to 828, i.e. +1,586,107%). `extremes` counts what was dropped. Below 5 companies after the trim, `trimmedMedian` is null rather than naming one or two firms a median.
Updated 17 Nov 2026, 03:31 pm