


live · early · 75 of 493 scheduled · last result 14 Oct
23 today · 49 tomorrow · 144 this week · HDFCBANK Sat · ICICIBANK Sat · BAJFINANCE Mon
75
493 dates known · last season 4,427
33%
very good + good, of 54 rated
+10.6%
median YoY, n=43
+1.9%
median, n=35
Numbers
Profit up at 31 of 43 (72.1%) · growing faster than 15%: 19 (44.2%) · Median excludes extremes: revenue 4, profit 4
Sectors
35 results from diversified or unclassified companies count in the totals but in no sector.
Next 7 days
Reports
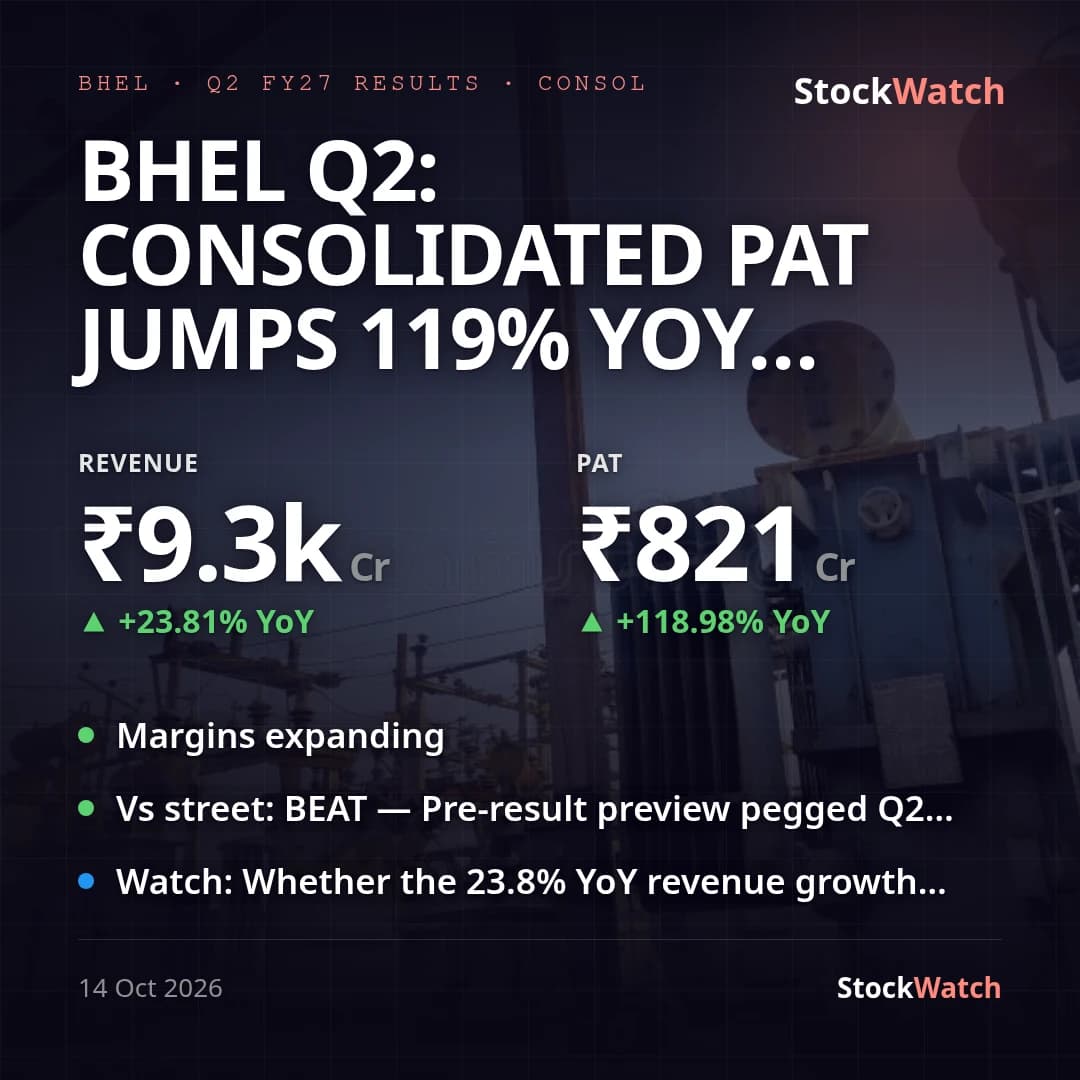 BHELResults14 Oct
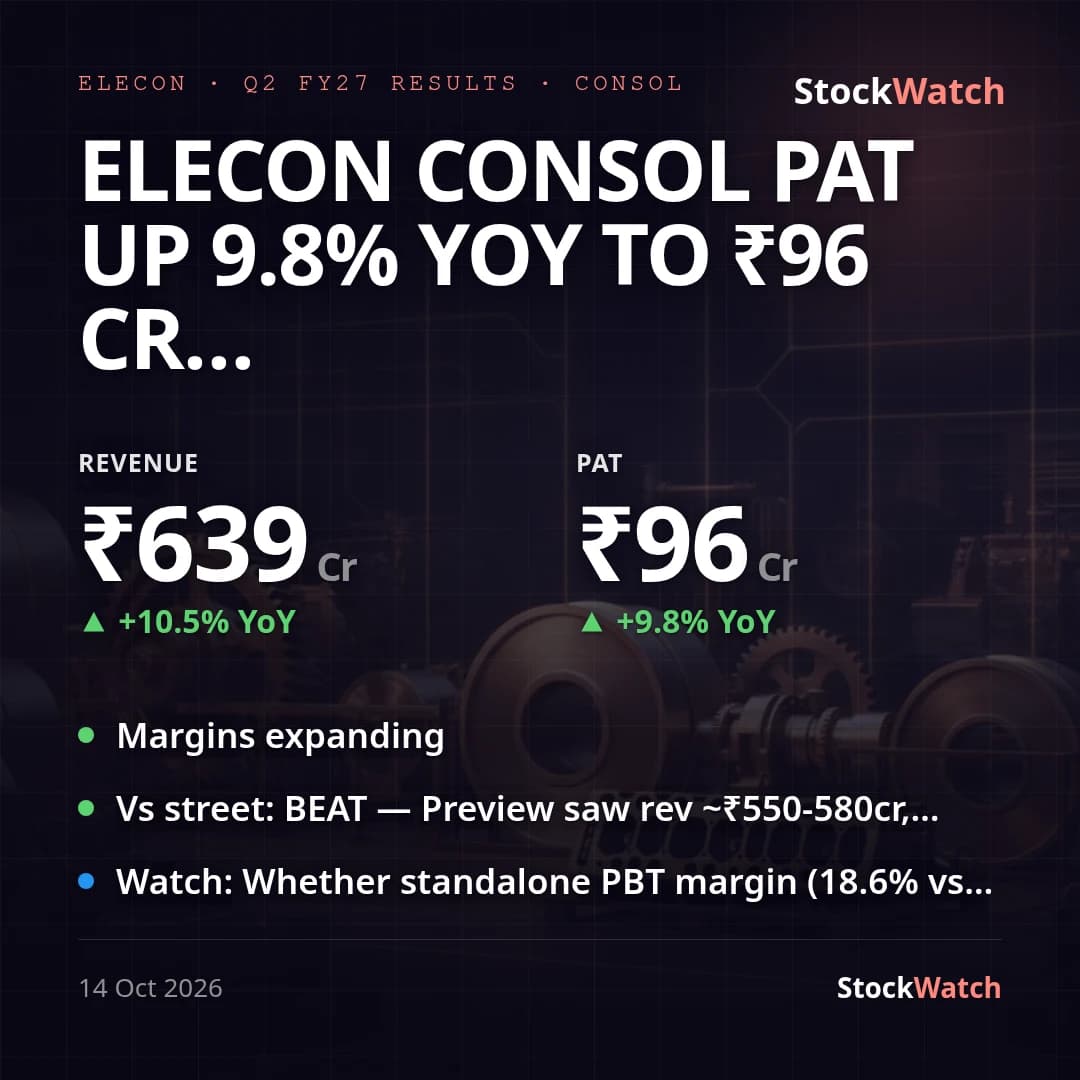 ELECONResults14 Oct
 GROWWResults14 Oct
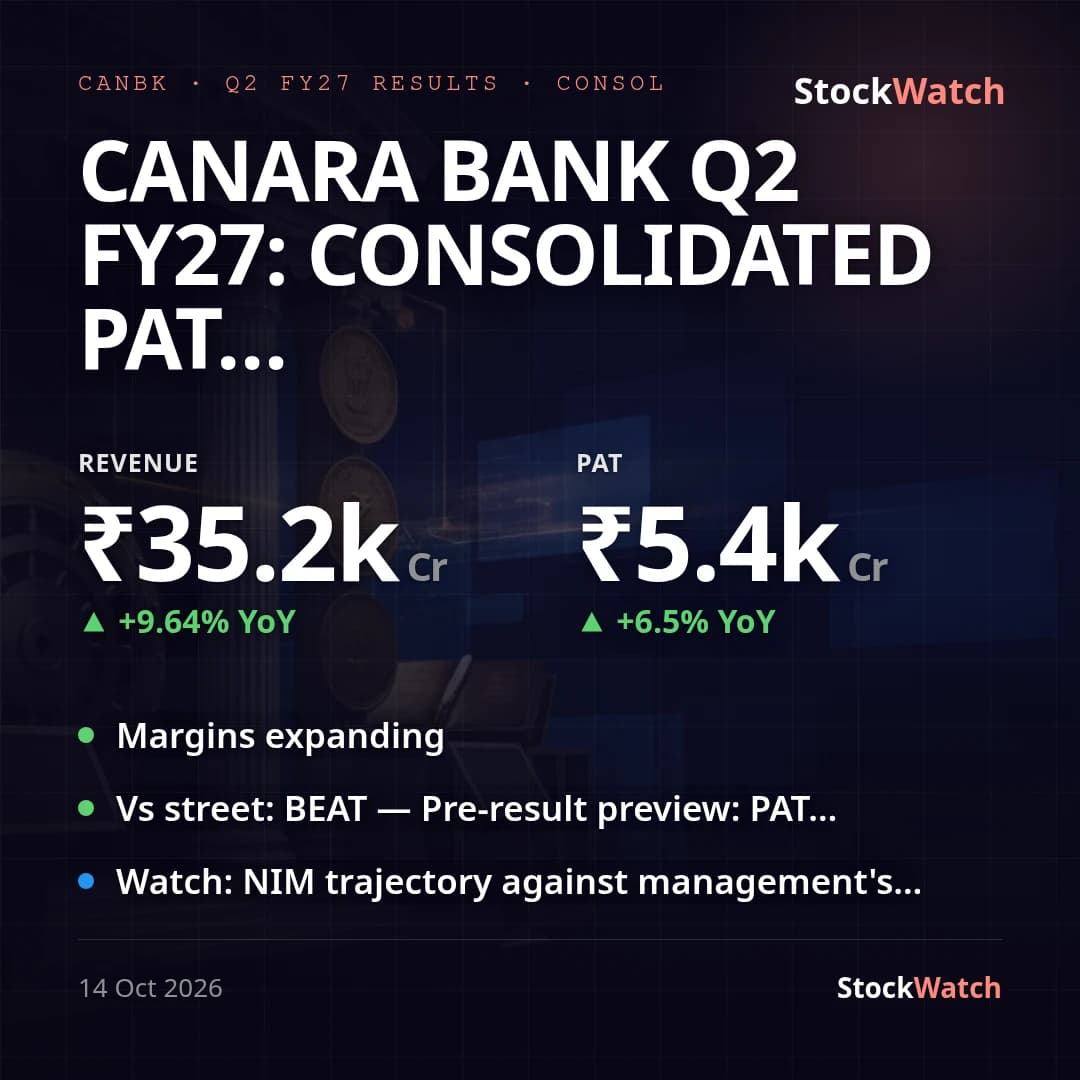 CANBKResults14 Oct
 NELCOResult preview14 Oct
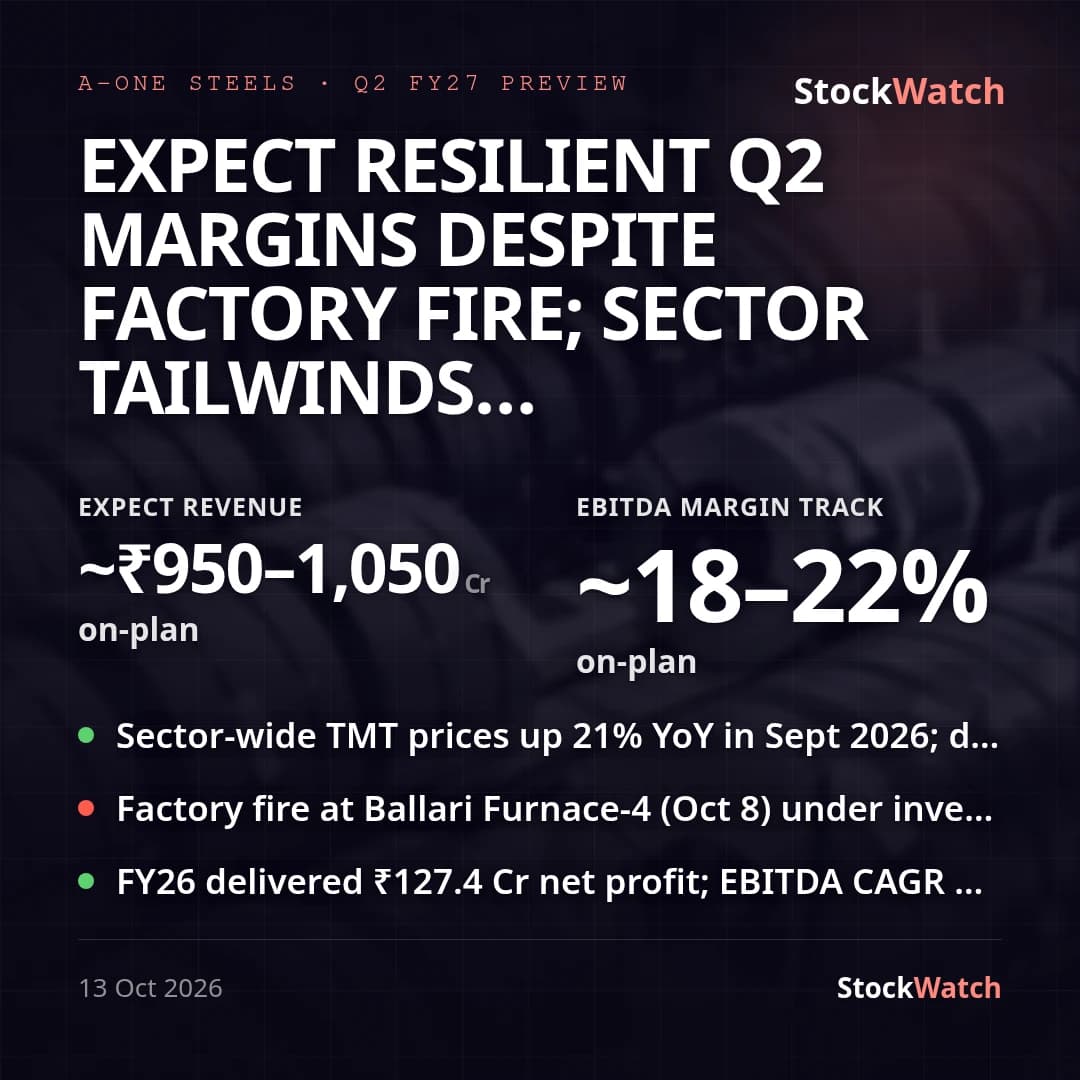 AONESTEELSResult preview14 Oct
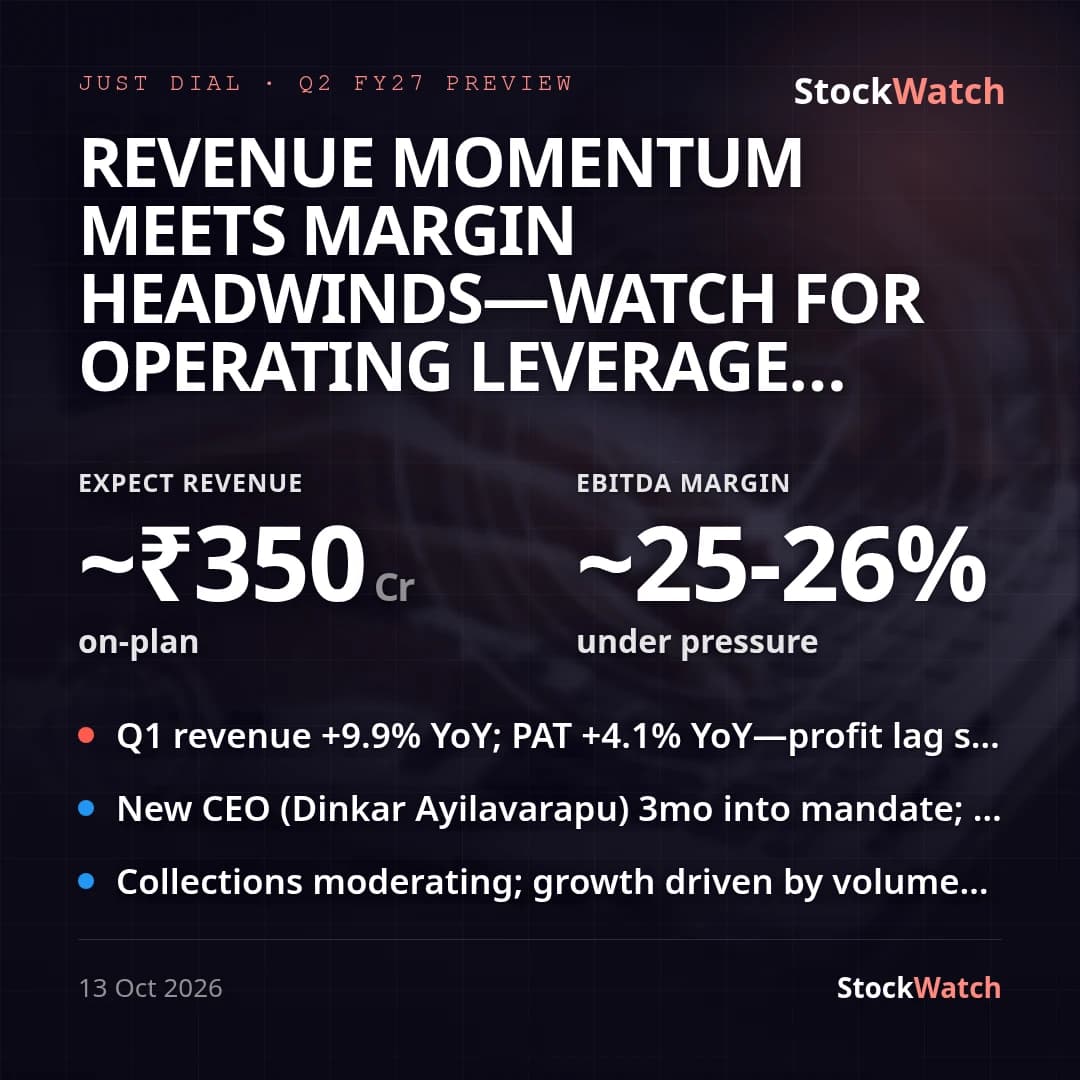 JUSTDIALResult preview14 Oct
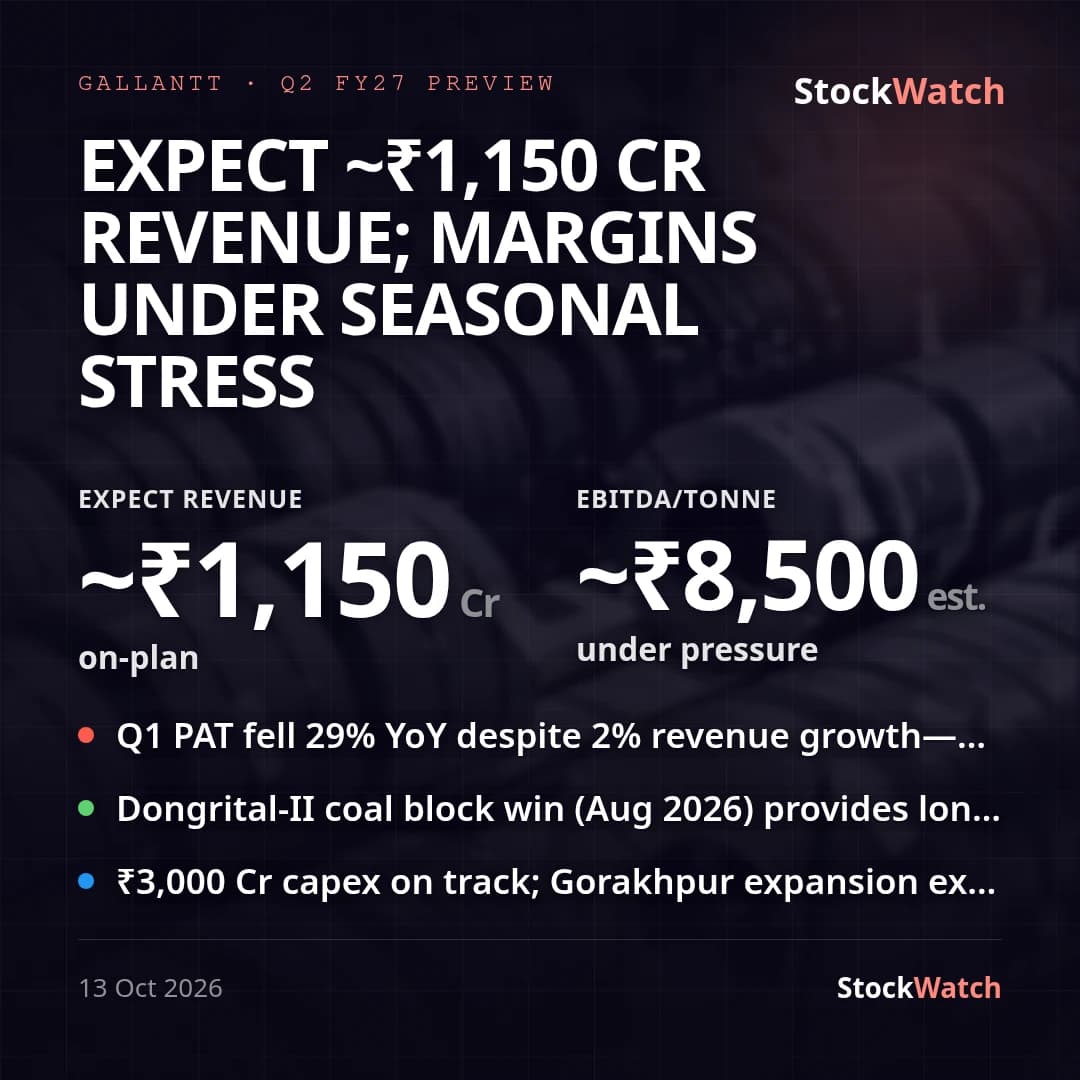 GALLANTTResult preview14 Oct
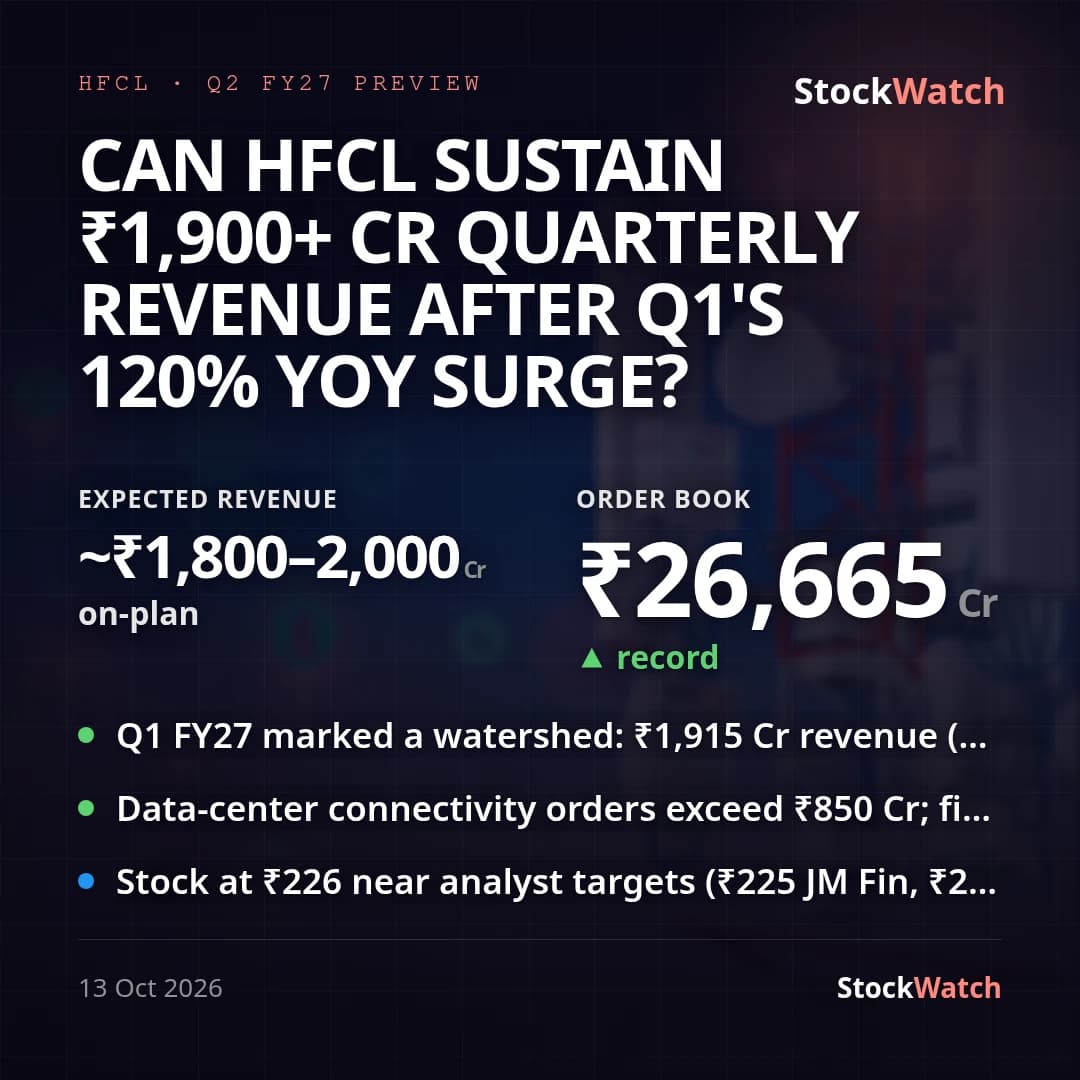 HFCLResult preview14 Oct
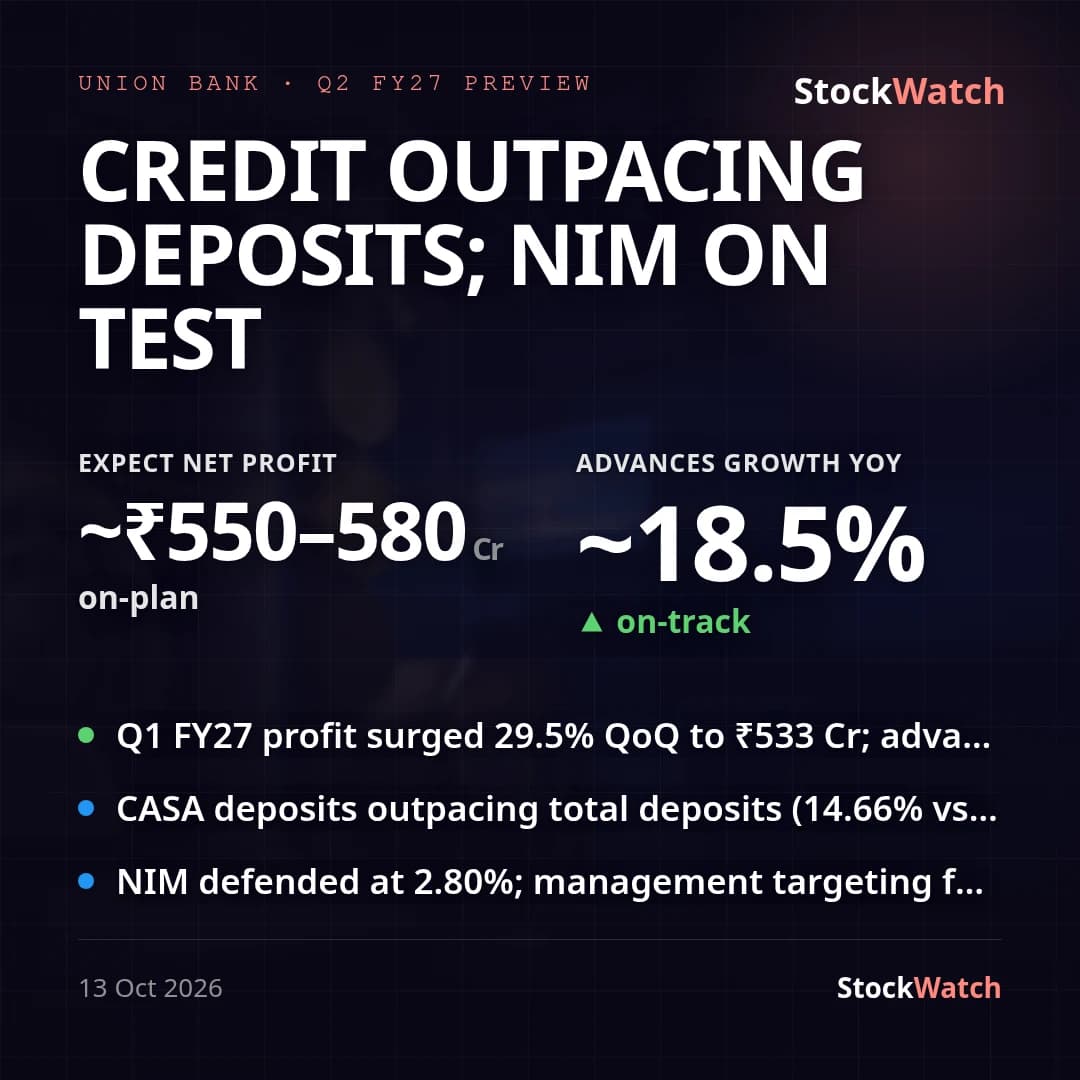 UNIONBANKResult preview14 Oct
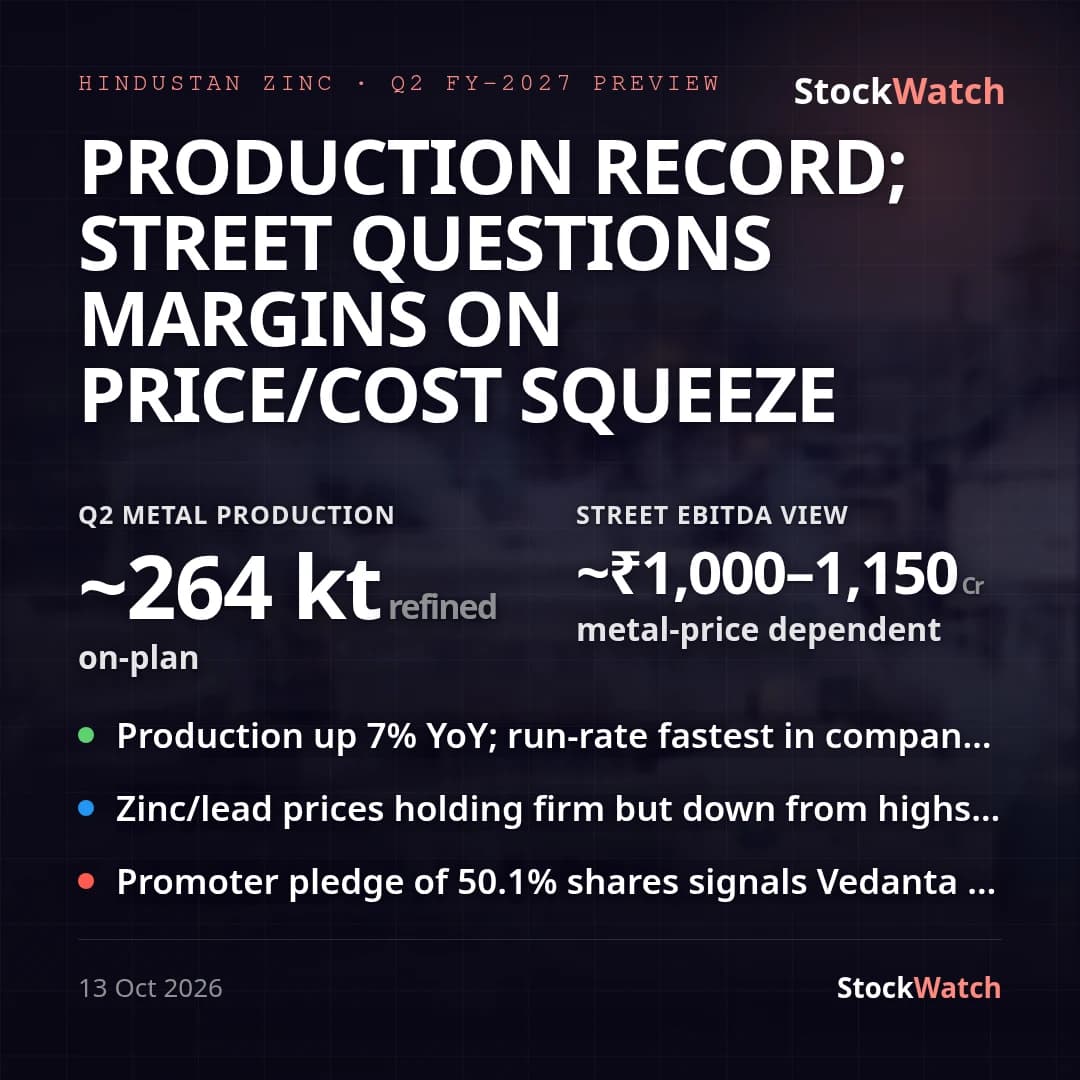 HINDZINCResult preview14 Oct
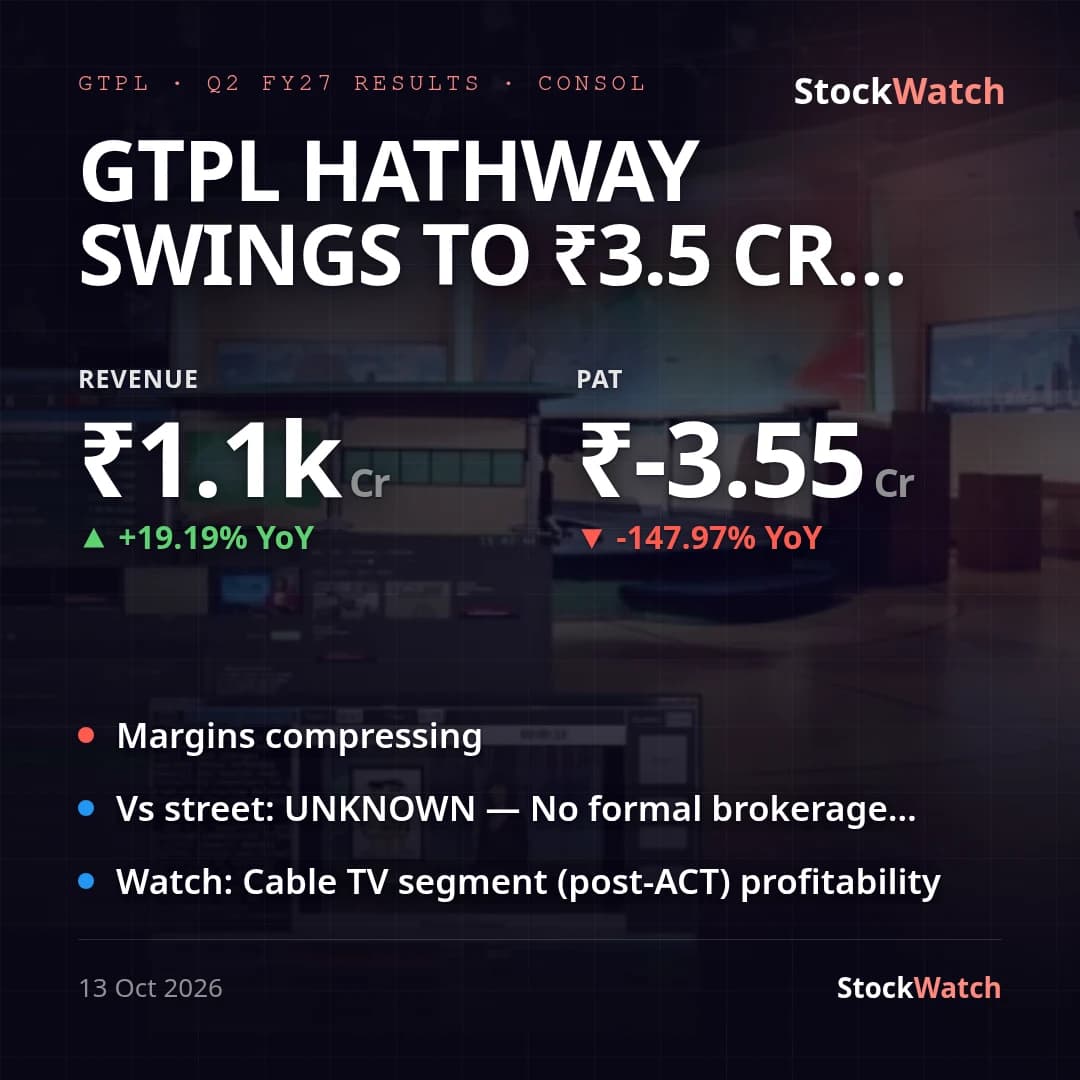 GTPLResults13 Oct
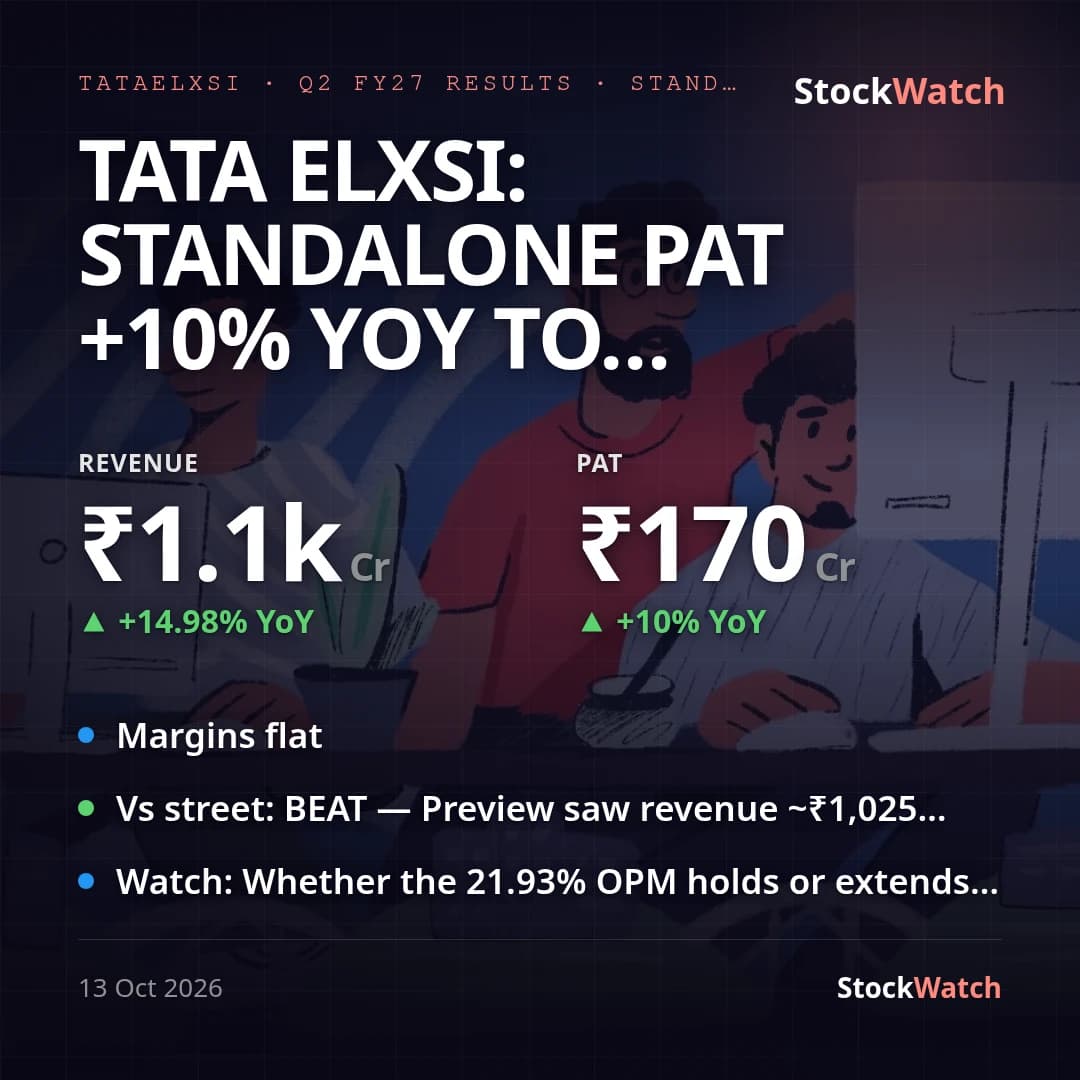 TATAELXSIResults13 Oct
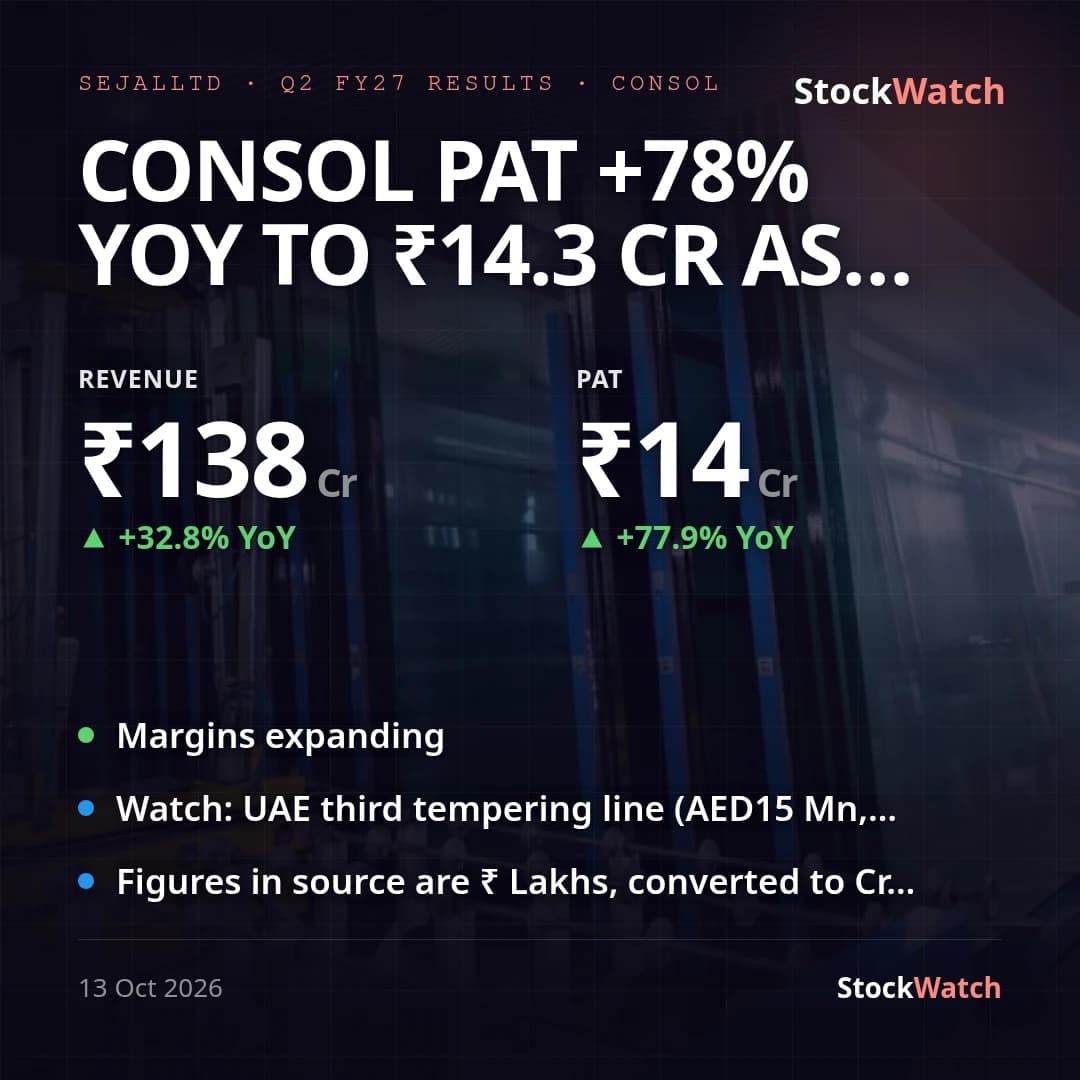 SEJALLTDResults13 Oct
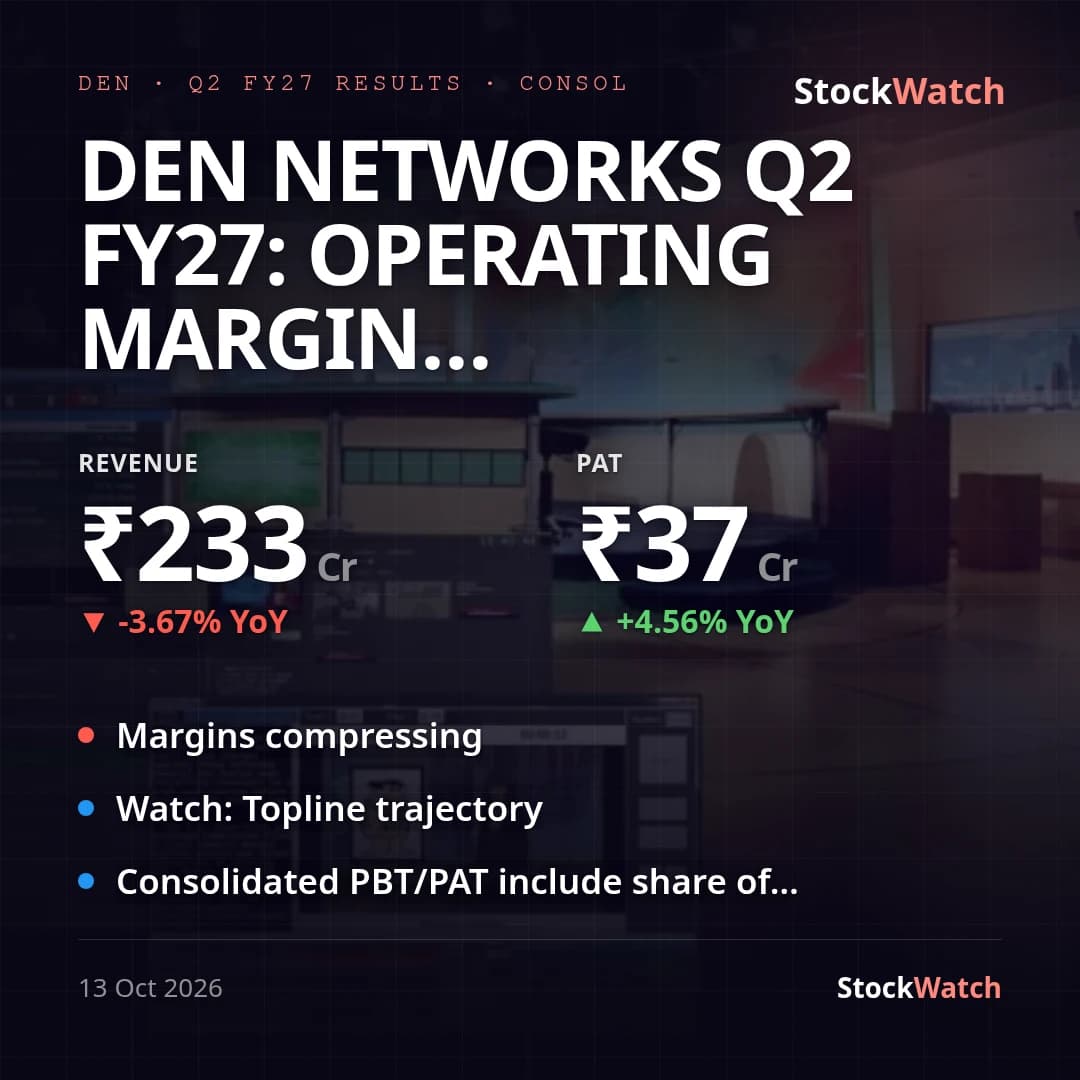 DENResults13 Oct
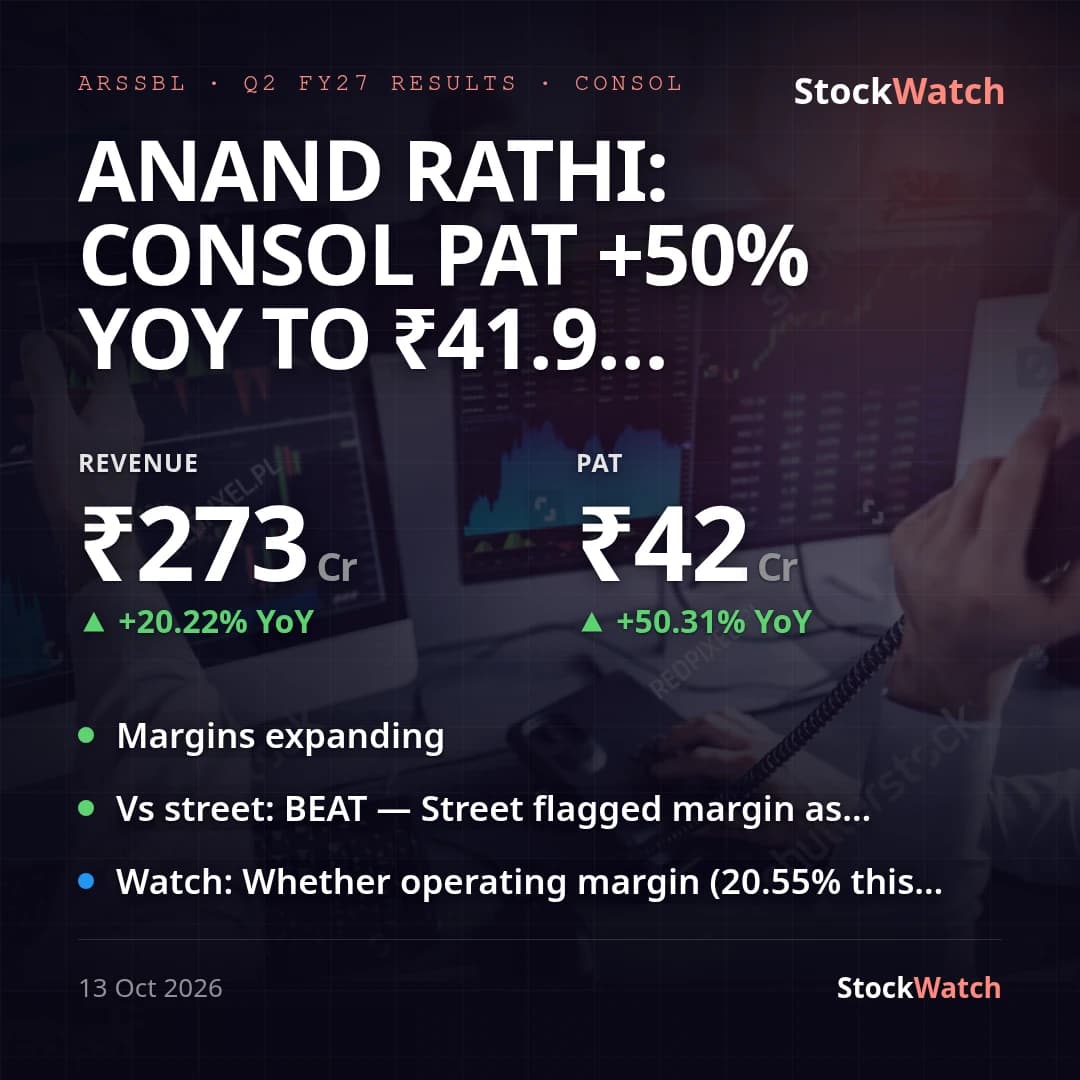 ARSSBLResults13 Oct
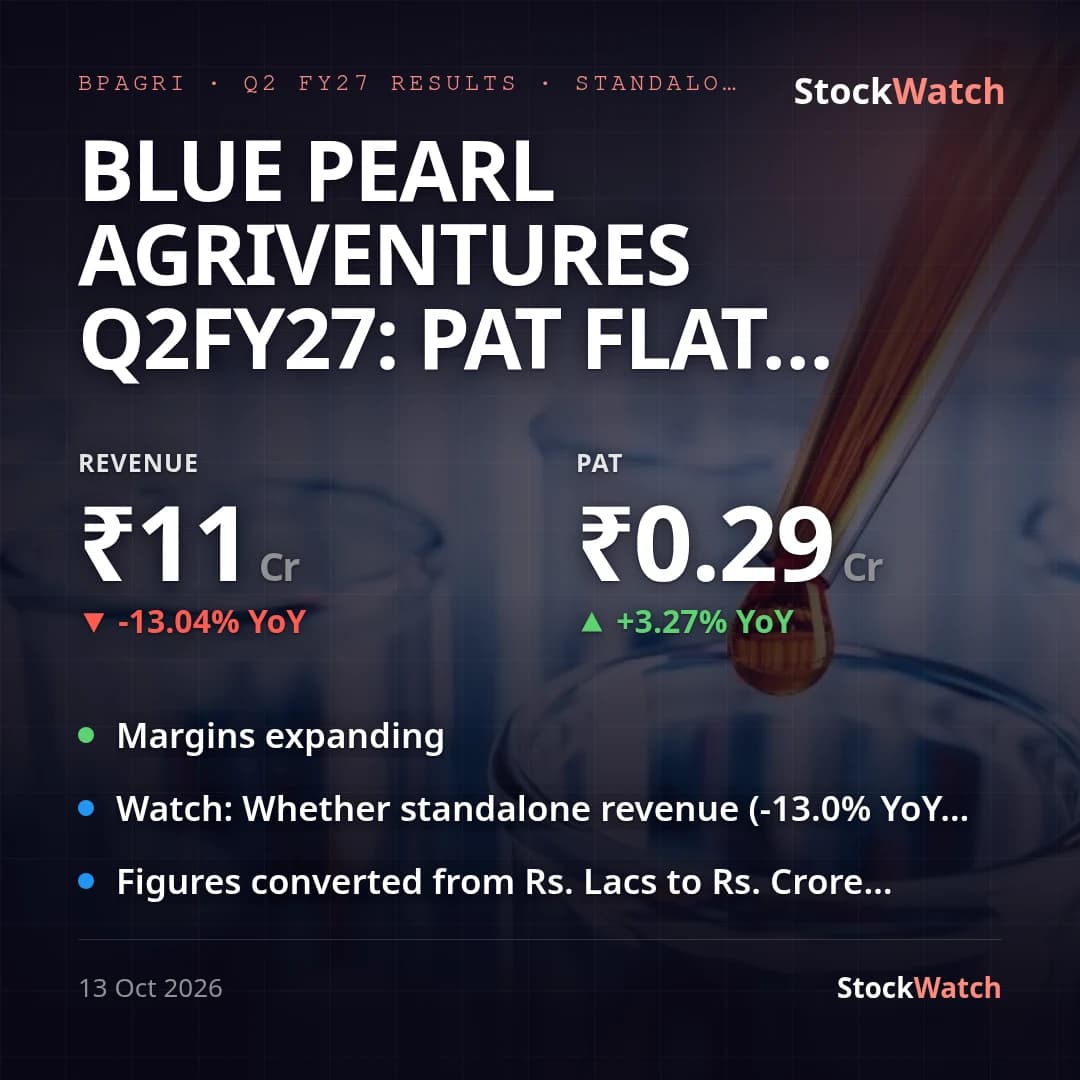 BPAGRIResults13 Oct
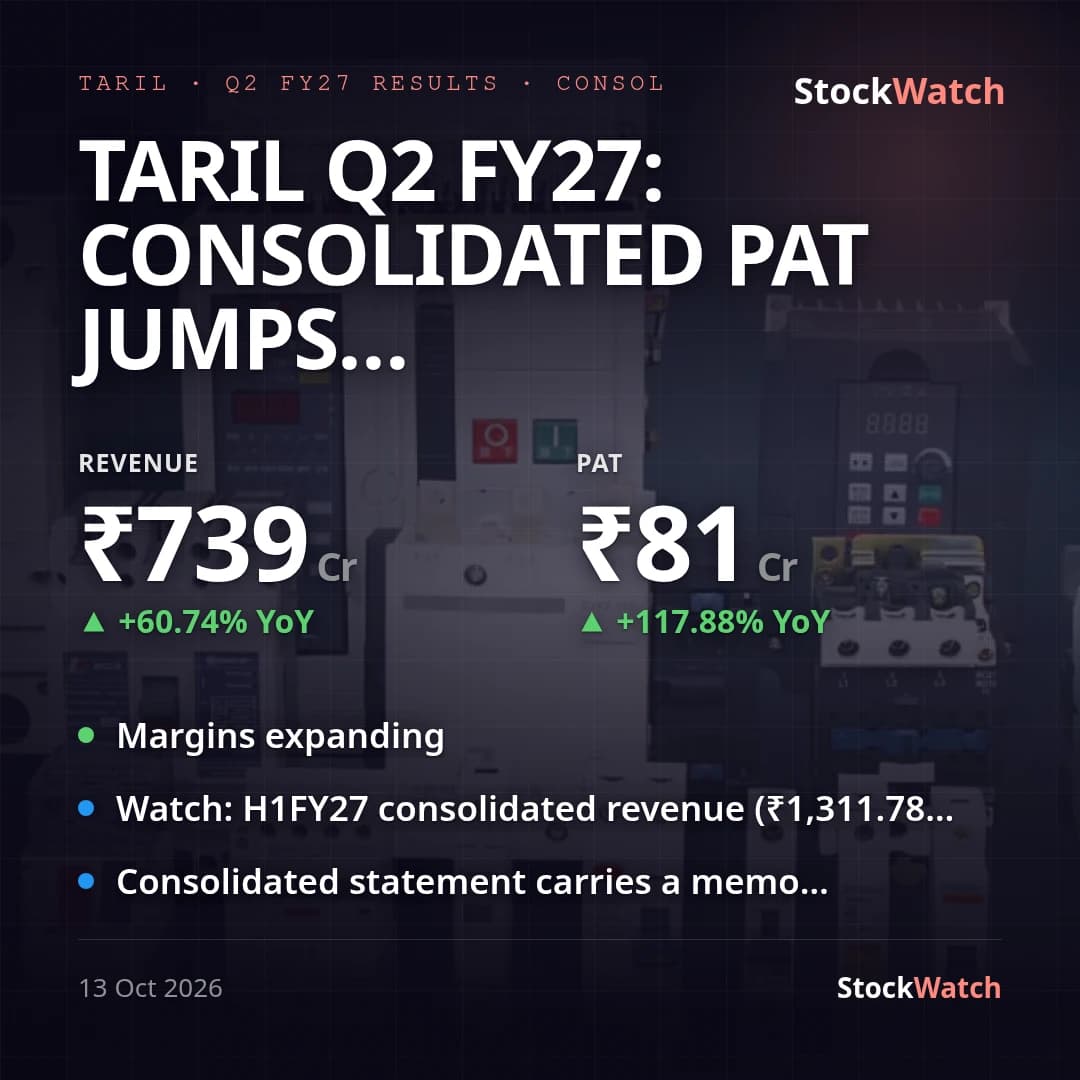 TARILResults13 Oct
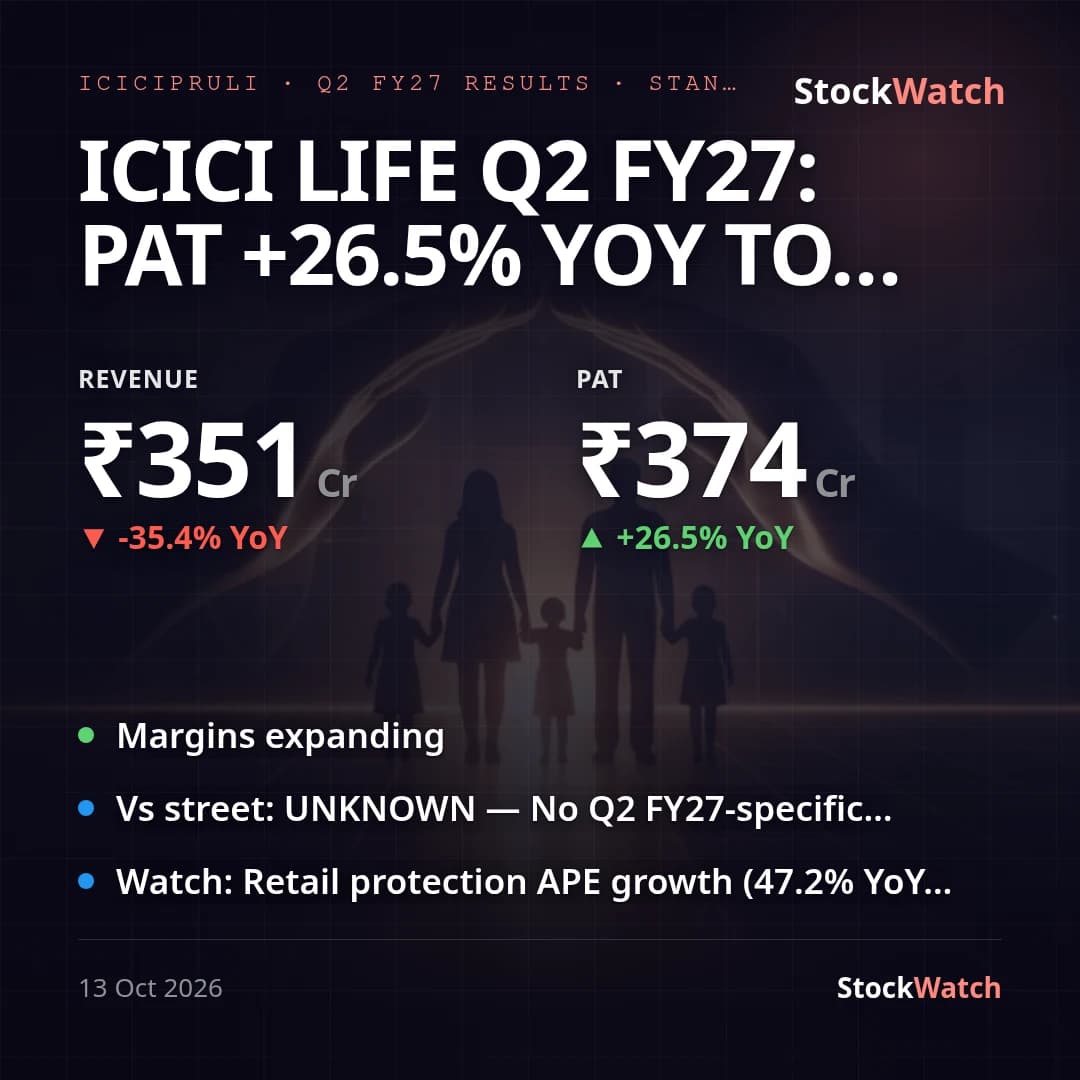 ICICIPRULIResults13 Oct
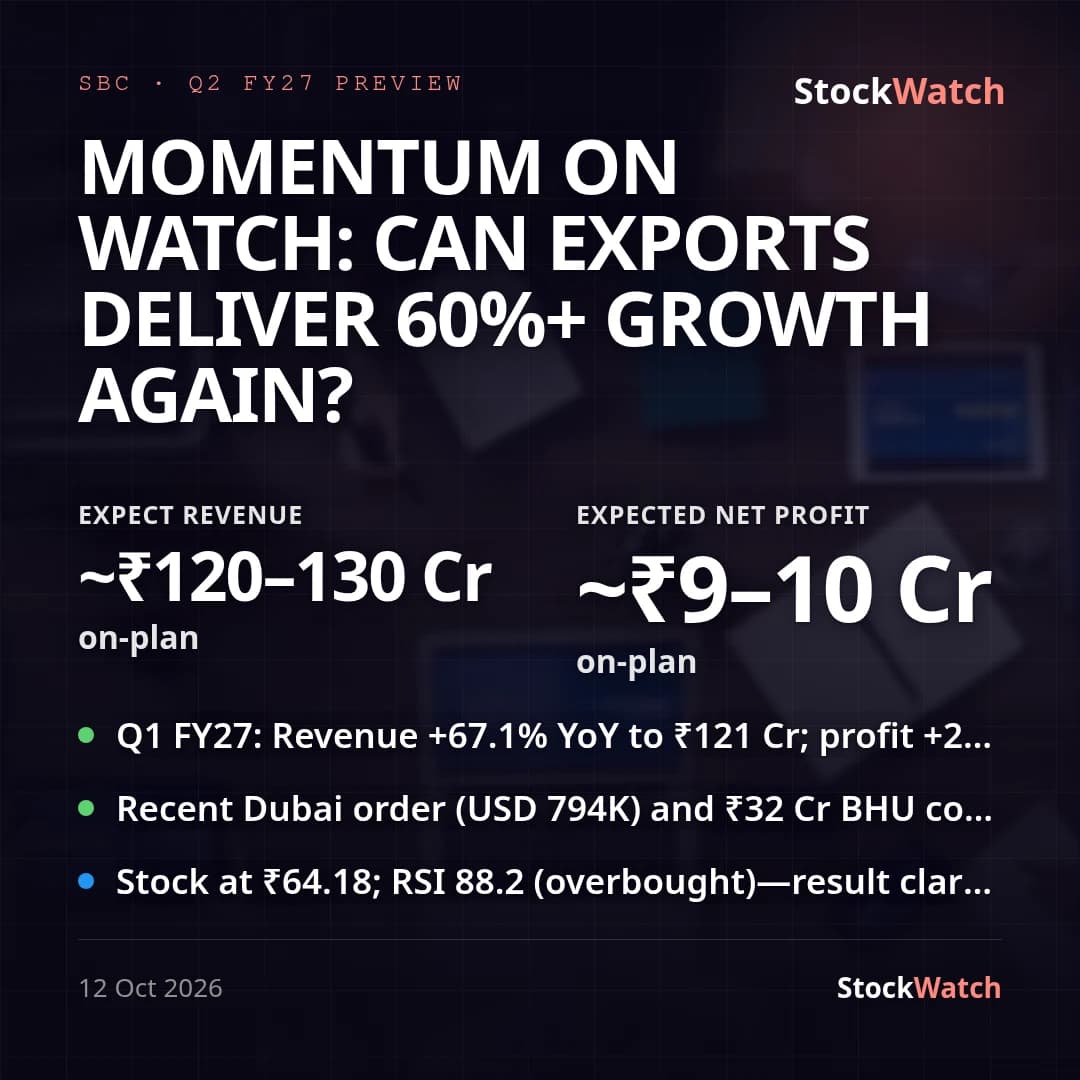 SBCResult preview13 Oct
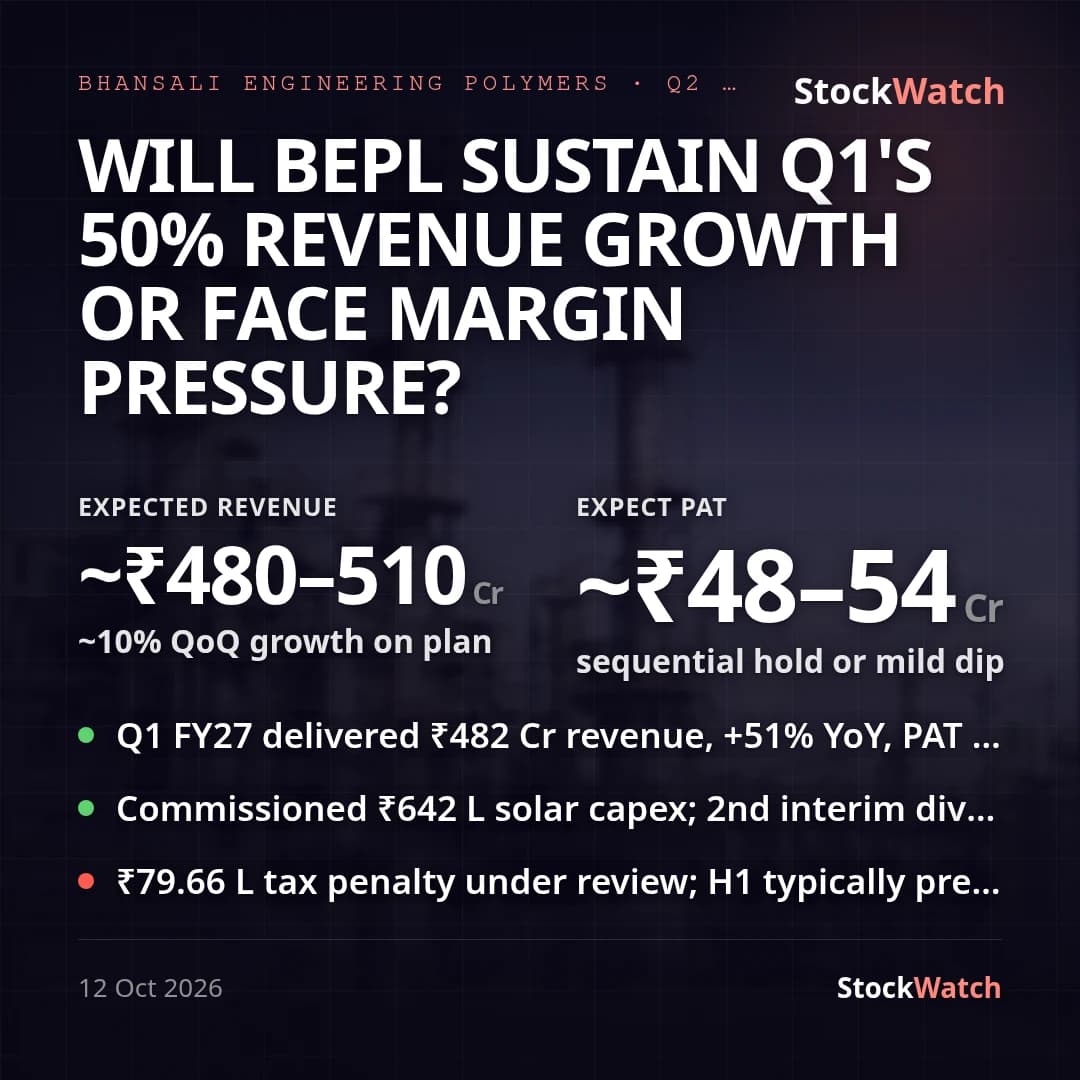 BEPLResult preview13 Oct
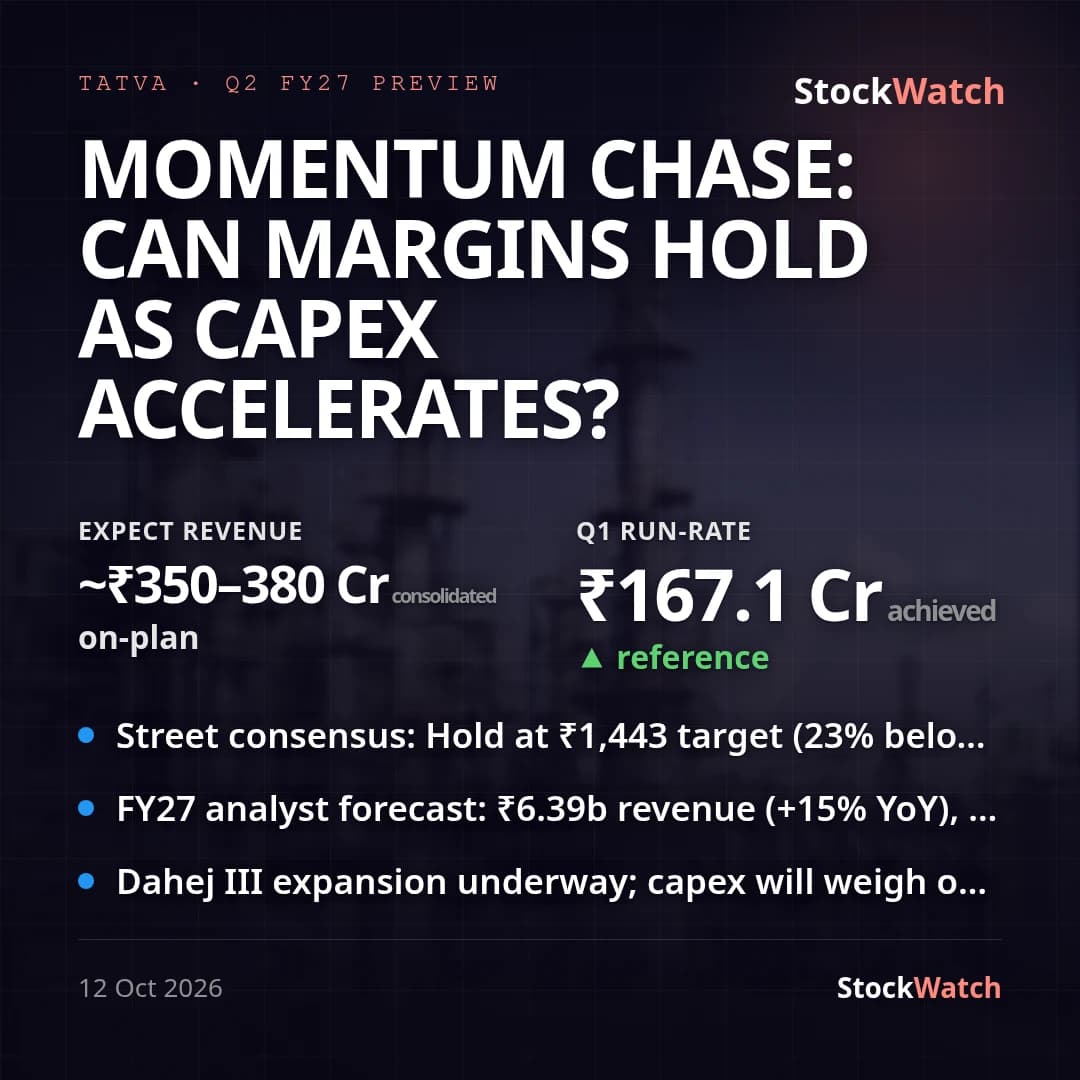 TATVAResult preview13 Oct
 ELEVATEResult preview13 Oct
 FEDFINAResult preview13 Oct
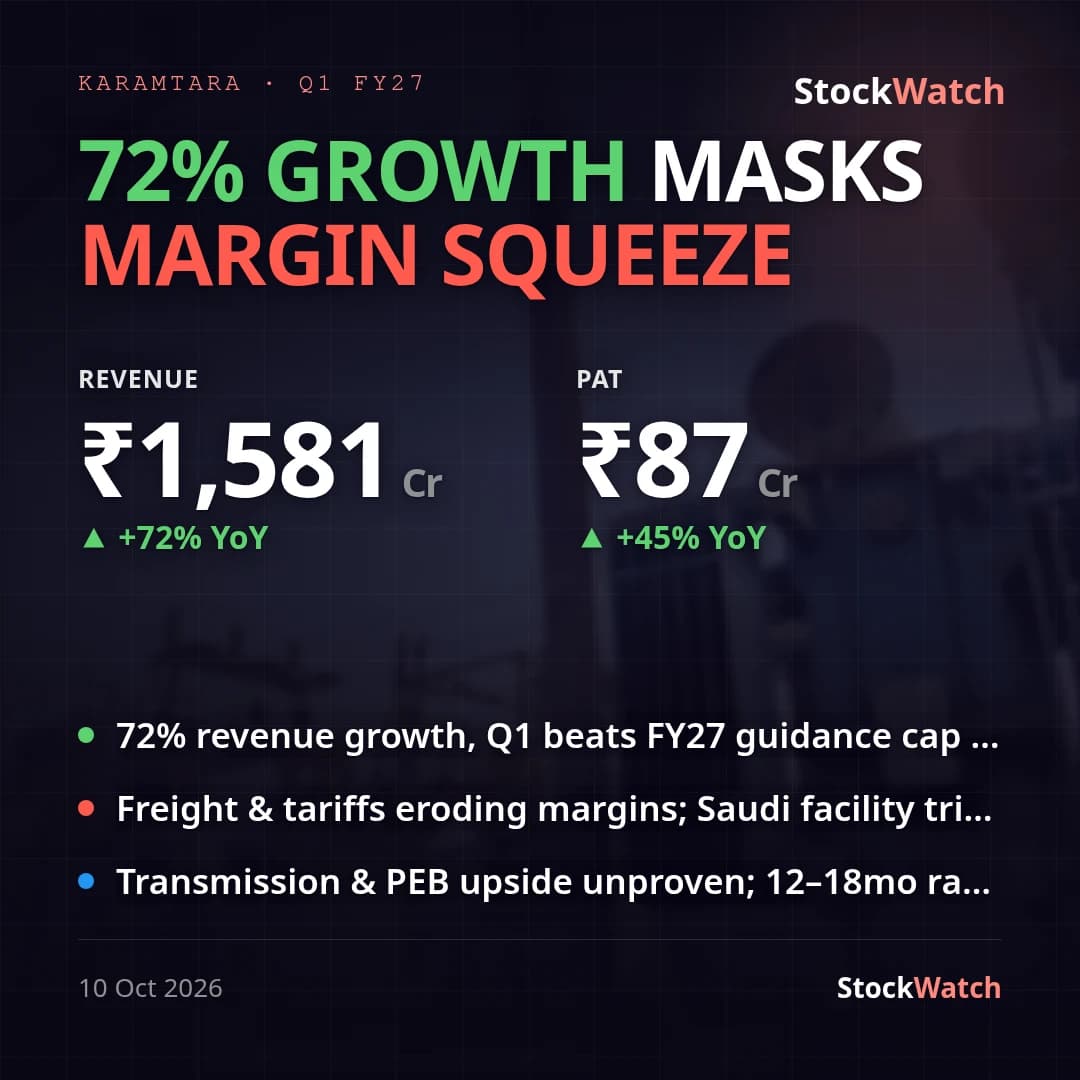 KARAMTARAResult verdict10 Oct
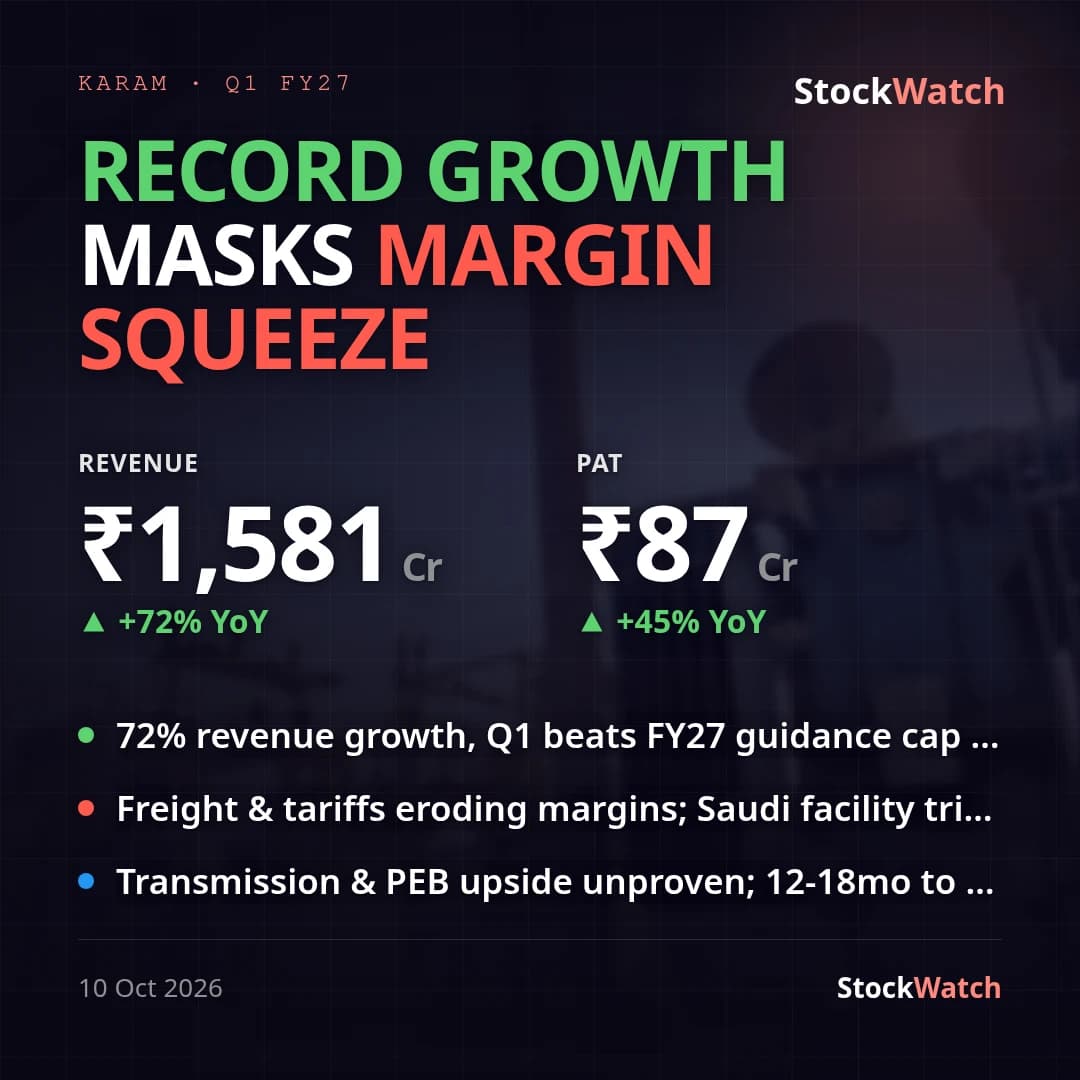 KARAMTARATranscript10 Oct
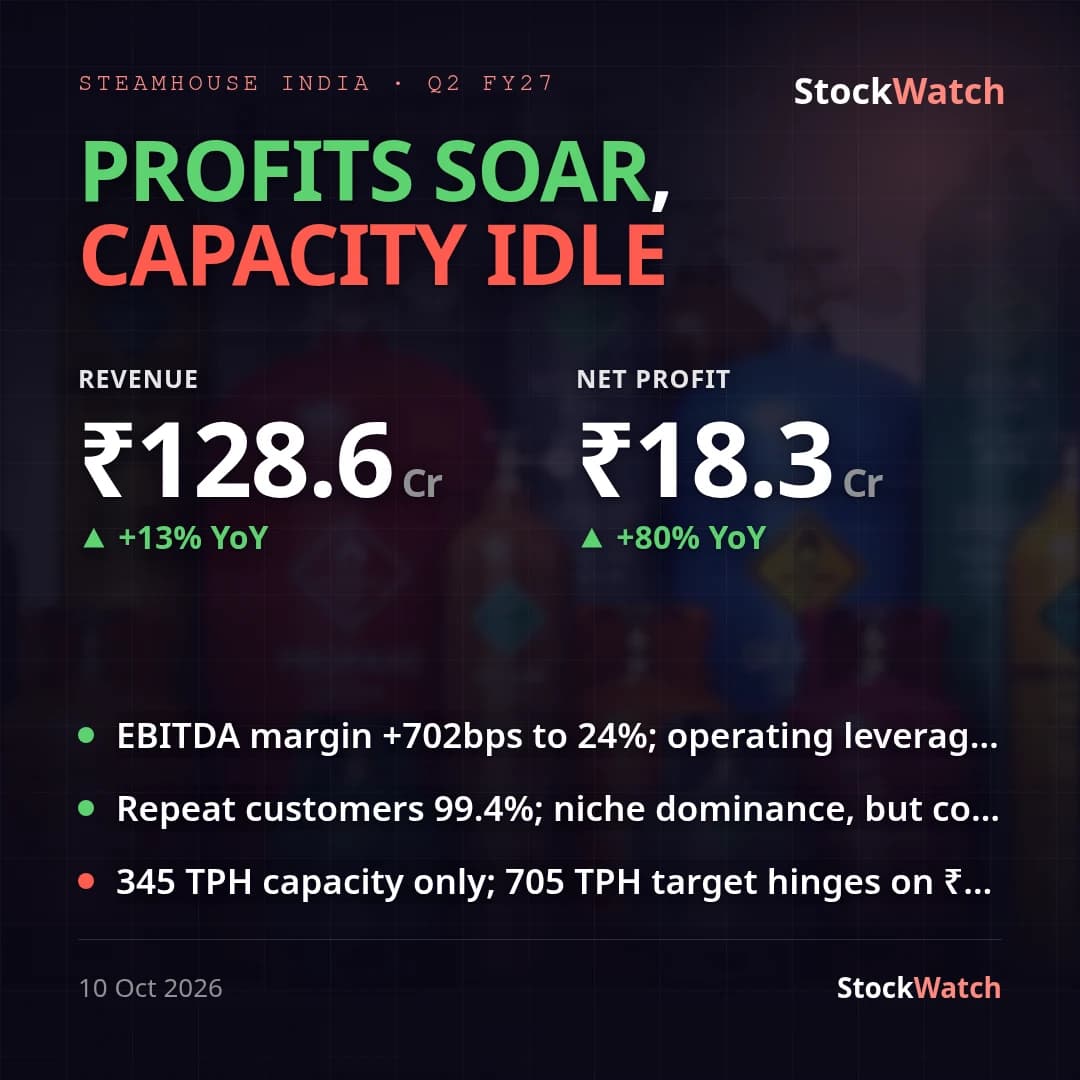 STEAMHOUSEResult verdict10 Oct
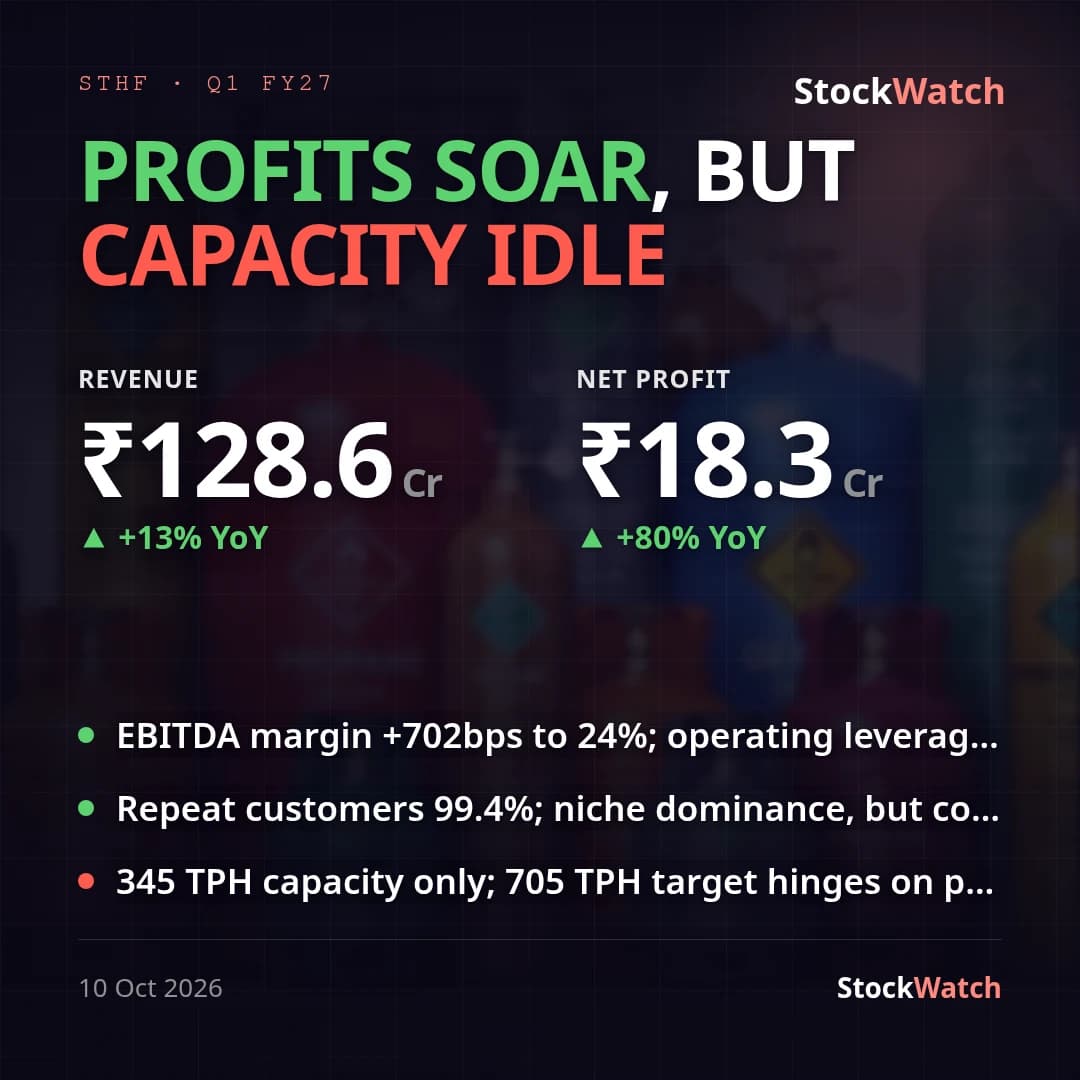 STEAMHOUSETranscript10 Oct
Reaction
Median day-1 move 1.9% · 20 up, 14 down of 35 priced
493 result dates are known so far; the bar fills against last season's 4427 results — a count, not a forecast.
StockWatch Result Rating is our own rating of the reported quarter, not of the stock; counts are of quarters rated so far.
Growth: year-on-year vs the same quarter of Q2 FY26, one basis per company (consolidated where both years report it, else standalone); banks, financial services and insurers by total income. Aggregate = growth of the summed values; median = the middle company. A company whose prior-year profit was a loss has no profit growth figure.
Day-1 reaction = the stock's move on the first session after the result, % vs the last close before it; medians are over quarters with a priced reaction.
Sectors are the 13 StockWatch groups; 35 quarters (diversified or unclassified companies) count in the totals but in no sector.
Size bands by market-cap rank across all listed companies we track: large = top 100, mid = 101-250, small = the rest.
Updated 14 Oct 2026, 01:40 pm